Original Link: https://www.anandtech.com/show/1602
Beating the System: The AnandTech Guide to Economic Upgrading
by Kristopher Kubicki & Jarred Walton on January 30, 2005 5:59 PM EST- Posted in
- Guides
Introduction
Throwing hard-earned cash down for computer purchases is never an easy task. Computer hardware can be a particularly tricky purchase, considering the sheer number of revisions, designs and price points at any one time. ATI and NVIDIA have over 100 cores combined for the AGP video market on shelves today. Yet, somewhere in that haystack of video cards lies the perfect video card, equally balanced in performance and price. Finding it can be a bit of a pain though. What we have decided to do today is step away from the specific type of guide format and look at buying components on a more general basis using mathematical modeling and historical data. We aren't going to tell you which hardware to buy per se, but we will show you the same methodology that we use when determining our picks for the week. We get really theoretical for the first few introductory pages before we get into the historical data, so bear with us if we sound like a college text book for a little while.
Let us cut right to the chase. When buying computer hardware – at least with a sane perspective – there exist only two goals in mind: minimize the Price and maximize the performance. Performance can be somewhat ambiguous, so in this analysis, we will refer to performance and features as Quality. We find later that Price and Quality are both predictable, yet dynamic equations, but the most basic building blocks of any economic model for computer hardware exist as Price (P) and Quality (Q).
It is actually very easy to put a data type on Price - it's just the dollar/yen/euro amount that the component costs. Quality, Q, is a little harder to quantify in the general sense. Everyone has different computing needs, and thus, it's virtually impossible for us to put a numerical value on the performance of a processor or video card in every application – but fortunately, we have benchmarks to simulate a vast majority of real world scenarios. The most critical and difficult step when computing your next purchase cost comes when we attempt to quantify Q. Don't let the name "quality" fool you either. CPUs, for example, make it easy for us to quantify Quality in specific applications because one product is always arbitrarily faster than another. Video cards, on the other hand, make it a little harder, since we need to put a value on additional features like TV tuning or Image Quality. We will get more into these concepts on the following pages.
When to Upgrade?
The million dollar question that we get asked every day, thousands of times a day is "When should I upgrade?" Actually, the questions are usually phrased like:- "Should I wait six weeks to buy a Radeon X800 XL?"
- "Is it worth it for me to upgrade to an SLI motherboard?"
- "Should I buy more RAM?"
Finding the right time to upgrade shouldn't revolve around the next best thing or even a particular component. The right time to upgrade can usually be modeled around how Valuable additional Quality is to you. The moment when you feel your Athlon XP 1700+ has put you behind a performance curve is the most opportune moment to start calculating how valuable an upgrade is to you. However, this can actually be quantified as well, and we will get more into that in the next couple of pages.
Another thing that we stress in our Buyer's Guides and Price Guides is to look at the entire picture when upgrading and not just a single component. You may feel that your Athlon XP 1700+ is too slow and that you need a new processor, but perhaps we can achieve better performance or Quality for cheaper by upgrading the video card instead. The solution actually hinges on looking at everything in the picture and not just individual components.
On the next few pages, we are going to determine the Value and Quality of some components and determine where the best upgrade path exists. This should answer the few example questions above, but the methodology can be applied anywhere we like when buying new computer hardware.
Quantifying Price
Something that Anand and I like to talk about is buying the best hardware that you can for your dollar, today. If you think about the long run, your time is expensive. Even if you don't have a lot of money to spend on upgrades or a new configuration, purposely procrastinating can sometimes be the worst thing. Waiting for the "next best thing" always results in a perpetual cycle of more waiting, and even more so in the computer industry. Instead of beating around the bush, let's go back to the original statement that we made about the ideal time to upgrade.
The right time to upgrade can usually be modeled around how valuable additional Quality is to you.
The principle seems fairly obvious, but it's easy to get lost in the NDA launches and rave reviews. A former executive to a very large motherboard company once told me that selling computer hardware was almost identical to selling produce. Every day that hardware sits on the shelf in a warehouse is another day that it loses value (to the company). With the exception of the short term LCD and DRAM spot markets, virtually all computer hardware sells for less today than it did yesterday. Sometimes we see small fluctuations in price where demand out-weighs supply, but for the most part, we don't see significant changes in computer hardware pricing like other commodities. Due to the extreme pace at which hardware evolves, buying computer hardware can almost always be summed up as, "What you buy today is cheaper tomorrow."
Prices don't fluctuate to the point where a product introduced today will cost more six months from now, and the path from today until then continually decreases (though not necessarily linearly). Then why do we recommend not waiting for the next best thing when buying a new component? If you feel that it's time to buy a new component, your value of that component should out-weigh the Price – even over time. If you plan on buying an Athlon 64 3200+ today for $200 versus $100 a year from now, hopefully your value of the component can be quantified at more than $100 per year. To state the obvious, if an upgrade doesn't have any value to you, it isn't worth buying.
Now, let's back up for a second. When we buy new upgrades, we tend to look at singular components – this can actually be a costly habit. As we stated on the previous page, even if you have a slower processor, the money may be better spent on a video card than on a processor. Instead of picking out a particular component set from which to upgrade, a more economic upgrade path may be to consider all components that fit in a particular price range and determine their relative Quality.
Quantifying Quality
Even though Quality is a numerical representation of performance, features and service, finding a method to determine an exact value of several different components to fit your user habits shouldn't be too hard. If you spend most of your computer experience gaming, then relying on gaming benchmarks for the games that you use is the most practical step. If you feel that the time to upgrade is now, so that you can get better performance out of Half Life 2, then the first step would be to quantify the Quality that a new hardware upgrade will bring to your system. A certain video card might double performance, so its relative Quality in the computer is 200%.
On the other hand, if we feel that we need to upgrade to maximize our storage space, then quantifying Quality over different components becomes even easier. Any video card that we add to the system would increase storage space by 0%; thus, the relative Quality of a Radeon X800 Pro when maximizing storage space is 0%. Subconsciously, we all do this same process at some level or another when buying hardware.
The dicey part gets when we start quantifying data that doesn't have a real world correlation – or perhaps data that isn't entirely complete. Determining the exact performance increase from a Radeon 9600 Pro to a Radeon X850XT is not something that you'll readily see published on AnandTech or anywhere else. The quick and dirty trick to determine relative performance on that scale is to find an intermediate product and look at the performance between those two. For a certain application, a Radeon 9800 Pro might be twice as fast as a 9600 Pro, and we also might know that an X850XT is twice as fast as a 9800 Pro. The resultant relative Quality should be about 400%.
We call that the quick and dirty method of finding relative Quality, but the only true method of determining the relative quality of one component compared to another is to have a test scenario. This is possible for more mainstream configurations as you can see in a lot of our motherboard reviews, but it's a little harder in real life. Our best advice is to pick conservative estimates for your quality assumptions.
Building the Model
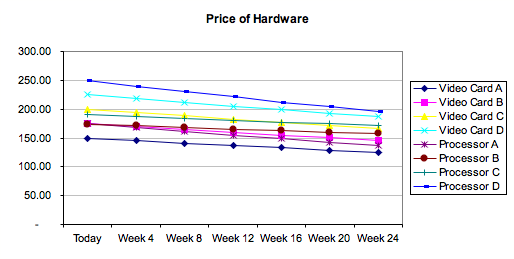
Before we get too carried away with variables and equations, it's time that we put something down on paper (or computer screen, in this instance). Without taking into account Time - when to buy - a simple plot of a set of products along the interval $150 to $250 dollars looks like this:
| Product | Price |
| Video Card A | $150 |
| Video Card B | $175 |
| Video Card C | $200 |
| Video Card D | $225 |
| Processor A | $175 |
| Processor B | $200 |
| Processor C | $225 |
| Processor D | $250 |
This chart is pretty useless. The reason why we introduced products deviating by $50 from our set allowance of $200 is to account for fluctuations in price once we introduce Time into the model. If all hardware devalues at the same dollar amount, exposing time to the equation is pointless. Generally processors take a dip in price every few weeks, so let's see what would happen if we put a 3% price cut on the products every four weeks on video cards, and a 4% price cut on processors. This discrete model doesn't make a lot of sense, since hardware generally devalues at a discrete rate, but in the meantime, we will use it for this example.
Here comes the important step - how much is your time worth? An easy way to visualize this is if you had a computer at work, and six minutes of your day every day was wasted waiting for Outlook to load up. Your company is paying you two hours a month on lost productivity. You can put any value per hour on this number, but let's say the Cost of not upgrading your existing hardware comes down to $0.25 per day; each day you don't upgrade it costs you another 25 cents on the resale value of your old hardware, or in lost productivity, or something else along those lines. The actual Cost to Not Upgrade (per day) can actually be something more abstract as well. Perhaps in the few hours per day that I play World of Warcraft, the frustration that I get while waiting for the screen to render is worth $0.25 per day. For the purposes of this example, we will just say that we value a new computer upgrade at $0.25 per day. This skews our graphs slightly.
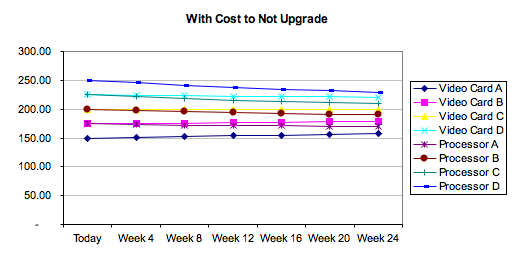
Things have changed a little bit on this graph. Notice that it actually gets more expensive to wait six months before buying Video Card C, even though the vendor sells it for slightly less. Putting this quantitative value on how much our time is worth per day gets us out of the perpetual waiting cycle that we had mentioned earlier. It becomes real easy to say "I can just wait six months for the cost to drop $200," but if that's your mentality, then why upgrade at all? The upgrade isn't needed if there is no cost associated with waiting.
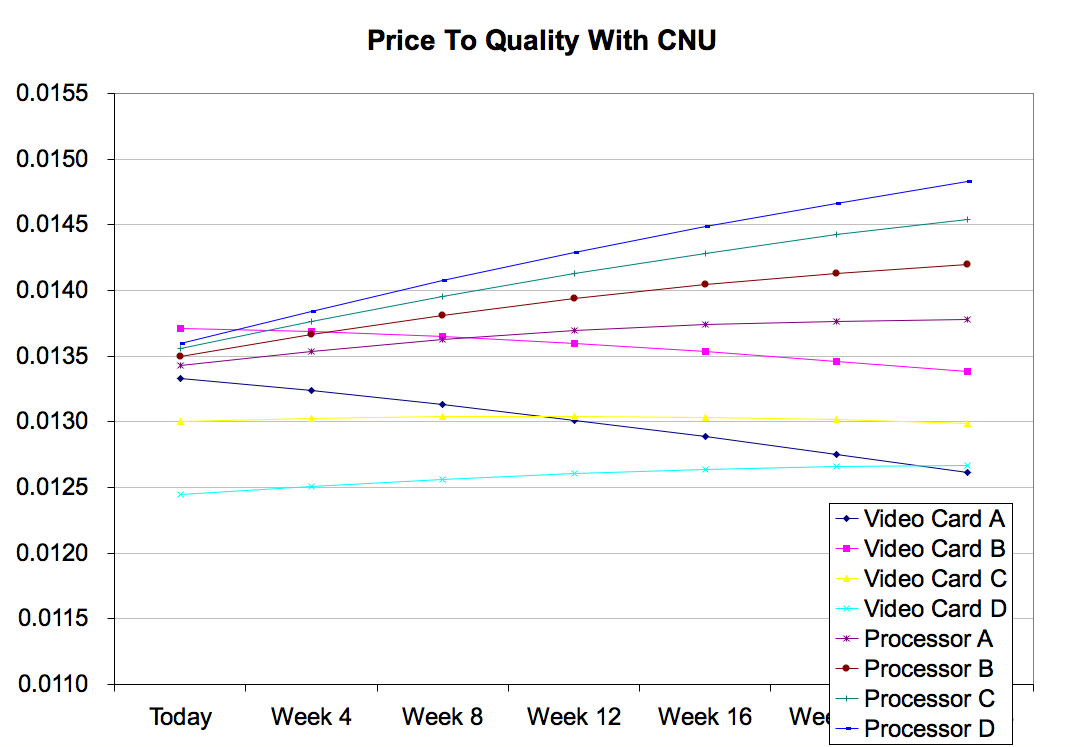
And finally, just to make things really interesting, let's take the Quality of each component and base it on a fictional benchmark like a video game. Each component's relative quality is listed as a percentage of base performance. Just by taking the price variable P and dividing by Q, we've changed our graph enough to give a pretty realistic representation of what a generic model looks like.
| Product | Price | Quality |
| Video Card A | $150 | 200.00% |
| Video Card B | $175 | 240.00% |
| Video Card C | $200 | 260.00% |
| Video Card D | $225 | 280.00% |
| Processor A | $175 | 235.00% |
| Processor B | $200 | 270.00% |
| Processor C | $225 | 305.00% |
| Processor D | $250 | 340.00% |
Click to enlarge.
What we are seeing in this graph is that we will get best return on our investment at different times for different parts, assuming the constant rate of decline in price and a 25 cents per day cost to not upgrade. For example, we get the the most out of a dollar by buying Processor D in six months - in fact, looking at the curve in the graph, it would be better to continue to wait even longer! If our time is only worth $0.25 per day, it apparently isn't worth it to buy any of the new processors today - only the "budget" processor A is a good buy. Otherwise, we would be overpaying for the Quality. Of course, Processor D is a little bit out of our price budget too. We maximize our price to quality by week 12 for Processor B, and Processor C looks to be leveling off towards week 24. All of the video cards, on the other hand, will actually maximize our performance for our dollar if we buy right now.
To demonstrate the entire process that we just described above, we created a simple Excel workbook. By modifying the assumptions highlighted in yellow, we can create a dynamic graphical process to easily verify two things: whether or not it makes sense to upgrade now, and the relative Price and Quality of each product in our set. The idea is to purchase the hardware that gives us the largest Price to Quality ratio while taking in account the Cost to Not Upgrade (we refer to this as CNU). If the maximum ratio exists at some other date than the start date of the model, then either our CNU per Day doesn't reflect our need to upgrade accurately, or the part in question is too expensive for its relative quality.
A Simple Example
Now that we have the basics on what a graphical model looks like and how it functions, let us see if we can construct something similar for actual components. For this example, we are going to rewind into the past six months and base all of our devaluation assumptions on actual data pulled from our RealTime Price Engine. Suppose our hypothetical machine to upgrade looks like the following:Processor: Athlon 64 2800+ Socket 754This machine clearly looks GPU limited, but we won't let that stop us from choosing a whole subset of new components for our price set. Since we just did an article on it, the goal in this example will be to spend around $200 for a computer upgrade in order to maximize Half Life 2 performance. Once again, we need to add some padding on each end of the $200 budget so that we can have some leeway when we introduce Time into the model. Our list of products is as follows:
Memory: 512MB DDR-400
Video Card: ATI Radeon 9600 Pro
Motherboard: MSI nForce3 K8N Neo-FSR
Processor: All Socket 754 Processors better than an Athlon 64 2800+
Video Card: All AGP video cards better than a Radeon 9600 Pro
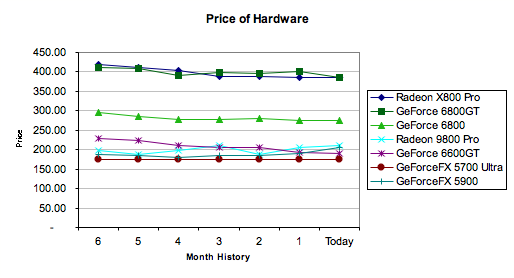
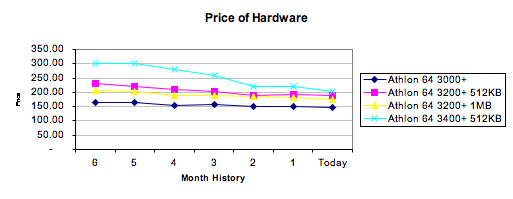
Let's plot as many of these components as possible on a graph denoting their price. We are slightly limited in our purchasing decision tree because we need to select components that fall within our designated price budget, but also components that are compatible with our hardware. This is a simple example, so we won't introduce components like memory, hard drives or motherboards for the time being. The prices were current prices as listed from the RealTime Price Engine. To keep our graphs neat, we separated video and graphics cards.
| Product | Price 6 Months Ago | Relative Quality | Product | Price 6 Months Ago | Relative Quality | |
| Radeon X800 Pro | $418.00 | 400.00% | Athlon 64 3000+ | $164.00 | 105.00% | |
| GeForce 6800GT | $412.00 | 400.00% | Athlon 64 3200+ 512KB | $230.00 | 108.00% | |
| GeForce 6800 | $295.00 | 260.00% | Athlon 64 3200+ 1MB | $205.00 | 110.00% | |
| Radeon 9800 Pro | $197.00 | 200.00% | Athlon 64 3400+ 512KB | $300.00 | 113.00% | |
| GeForce 6600GT | $228.00 | 240.00% | ||||
| GeForceFX 5700 Ultra | $175.00 | 100.00% | ||||
| GeForceFX 5900XT | $187.00 | 170.00% | ||||
This is a simple example geared toward a single application, so take these numbers with a grain of salt. You can see that we simply marked average FPS percentage increase as our quantitative values for Quality, but if we introduce more applications into our objective, we will have to use different values for Quality. We have placed some fairly conservative estimates on the relative quality between each component, but we cheated a little with the GeForce 6600GT and used the PCI Express pricing instead to demonstrate the model.
Below, you can see the actual price of each component as it changed throughout the last six months (The 6600GT is using PCIe pricing).
This looks real interesting, particularly with the subtle price swaps between each video card in the $200 segment. Now, we are just going to tilt the axis a little bit as we introduce our CNU variable of $0.25 again. After all, if our time is worthless, what is the point in upgrading this century?
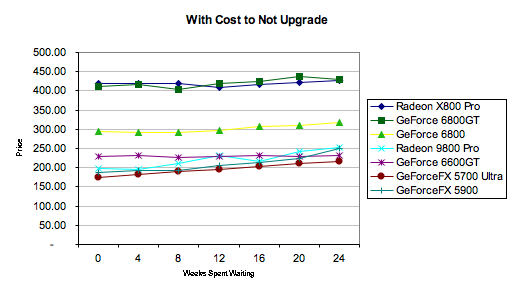
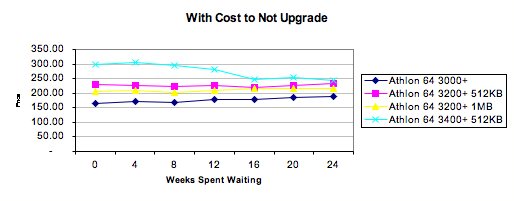
Things are looking really smooth now. In every instance, it is cheaper to buy today rather than buy tomorrow when we consider the $0.25 per day that it costs us to suffer through another agonizing frag fest at substandard performance. Finally, we just need to introduce quality into the equation and see which of these components maximizes our value, and when.

Click to enlarge.

Click to enlarge.
August 30, 2004 would have been a particularly fun day to determine an upgrade for a new system. In retrospect, the best card to purchase at that date would have been the GeForce 6600GT – but as we mentioned earlier, we flubbed the data a little bit for that video card, since only the PCIe version existed at that point. The second best performing card, for the dollar, was the Radeon 9800 Pro. We didn't even need to consider the higher end cards, since the laws of diminishing returns automatically compensated. Since the Radeon 9800 Pro is an older SKU and its price has been relatively static, it quickly falls off the board as the best value card, but it still has a higher Price to Quality ratio than anything else around $200 – including CPUs.
All of the data from this page can be viewed in the Excel workbook here.
Putting it all together
So far, we showed how easy it was to build a model with retrospect data and how easy it was to build a model with made up continuous data. The goal now is to build a hybrid model from the previous two. Below is a list of hardware from the previous example, but using continuous devaluation overrides to "predict" the cost of each product after every four weeks.
| Quality Assumptions | Devaluation Override | |
| Radeon 9800 Pro | 200.00% | -1.00% |
| GeForce 6600GT | 240.00% | 1.67% |
| GeForceFX 5700 Ultra | 100.00% | 0.00% |
| GeForceFX 5900XT | 170.00% | -1.00% |
| Athlon 64 3000+ | 105.00% | 1.67% |
| Athlon 64 3200+ 512KB | 108.00% | 1.67% |
| Athlon 64 3200+ 1MB | 110.00% | 1.67% |
| Athlon 64 3400+ 512KB | 113.00% | 1.67% |
Again, continuous functions are bad for attempting to predict hardware pricing trends because pricing models for most components are structured on a discrete stair step algorithm using various price points. For those of you familiar with our pricing guides or the RTPE, you'll know that we watch a lot of prices at any one time. Purav, Adul and I can recite the exact distributor MRSP on every Intel processor at any given moment. We notice specific trends that can be readily identified with our historical data in the Real Time Engine (the graphs). Generally, after a new product has stabilized in price a little bit, a new processor, motherboard or video card will continue to devalue about 1.67% per month until the products retail EOL. Low demand products that hit EOL cling to their MSRP for a while (thus 0% devaluation) while high demand products will actually start to increase in price due to supply and demand (usually less than 1% per month). The Radeon 9800 Pro is actually a very good example of a video card that went through all three phases during its lifetime as a retail product. When all else fails, be a little too conservative with your estimates; the only thing that the devaluation should affect is whether or not it makes sense to upgrade today.
With some quick calculations, we can generate the estimated prices for the next six months based on today's hardware prices and the devaluation overrides that we just discussed above. The resulting graph looks as such:
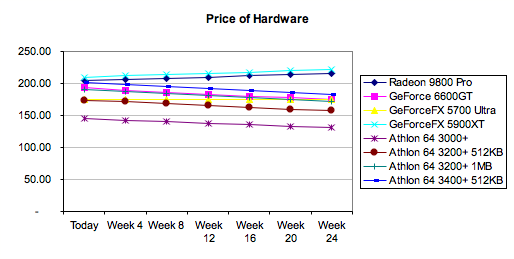
Now, we can introduce our CNU value of $0.25 per day again and replot the graph.
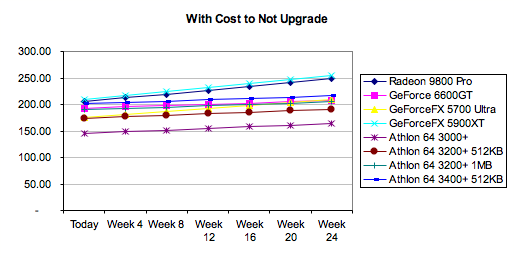
It should be pretty clear which hardware not to buy at this point; buying a GeForce 5900XT six months from now (if you can still find one) will cost you double, since you are paying for the retailers to mark up the price on their remaining stock even before taking into consideration the CNU. Adding the relative Quality for each product gives us the final plot below.

Click to enlarge.
Just based on mathematical formulas and some educated assumptions for relative Quality, the GeForce 6600GT comes out on top again with the Radeon 9800 Pro a mildly distant second. Upgrading the processor instead of the graphics card might actually make sense in this scenario (after the 6600GT) with the weights that we've given based on HL2 CPU and GPU scaling. All of the data from this page can be viewed in the second excel workbook from the spreadsheet available here.
Final Thoughts
Hopefully, it can be said that making intelligent purchasing isn't too difficult if you don't mind spending the additional time to lay the equation out. Of course, purists would argue that if it took you 2 hours to build a working model of the component pricing environment and only "saved" $2, you've just subconsciously quantified your time at $1 per hour. On the other hand, given some practice and intuition, most people can build models like these in just a few minutes.
Of course, modeling in this manner is not without limitations. The first limitation is that a typical computer user's habits can be very dynamic. It can be very difficult to quantify the Quality of several computer components without a clear indication of what applications will be used. Furthermore, it can also be very difficult to model several dependent components at a time, since relatively little performance data exists. Buying a new video card and processor combination might make more sense than buying more memory, but buying more memory might make more sense over buying each one of those components individually. Although we do our best to benchmark as much popular hardware as possible, sometimes picking relative values for Quality is not as cut and dry as we would like.
For those of you who enjoy the more theoretical and mathematical side of this buyer's guide, we may revisit this guide in the future or perhaps build more complex models using a much vaster criteria and budgets. In the meantime, feel free to try out your own ideas in the spreadsheets that we've provided. For example, let's say that you can afford $2 per day for upgrades - take it out of your food budget. This might describe an individual who likes to stay on the high end of computing performance, and suddenly, it starts to make very little sense to hold off upgrading. Just remember to adjust the quality values relative to what you currently have.


