Original Link: https://www.anandtech.com/show/10481/the-samsung-850-evo-4tb-ssd-review
The Samsung 850 EVO 4TB SSD Review
by Billy Tallis on July 11, 2016 10:00 AM EST
In 2014 Samsung brought 3D NAND (branded as V-NAND) to the consumer SSD market with the 850 Pro and 850 EVO SATA SSDs. Based on the MLC and TLC versions respectively of Samsung's 32-layer second-generation V-NAND process, both models raised the bar for SSD performance and remain essentially unchallenged except by PCIe SSDs. The 850 EVO in particular defies the usual image of TLC SSDs as being relatively slow, power-hungry, and susceptible to problems with long-term data retention or write endurance. Most TLC drives are low-end or at best mid-range in the SATA market, but the 850 EVO for the most part competes against MLC drives in the mid to high end of the market.
Last year, the 850 Pro and EVO lines were expanded with 2TB models based on an upgraded controller with support for the larger quantities of DRAM required to keep track of so much NAND flash memory. The 2TB 850 Pro introduced a 128Gb die version of Samsung's 32-layer MLC V-NAND to replace the 86Gb die used by the smaller 850 Pros. However the 2TB 850 EVO continued to use the same 128Gb TLC V-NAND as in the smaller capacities.
Later in 2015, Samsung announced their third-generation 48-layer V-NAND process to provide 256Gb MLC and TLC parts. The plan was to switch existing products like the 850 and 950 series SSDs over to the new V-NAND beginning in early 2016 and to introduce the higher capacities it enables. The transition to the newer V-NAND has not been as quick as originally planned, but we have seen it show up in the Portable SSD T3 and the 1TB 850 EVO M.2 that has recently become available.
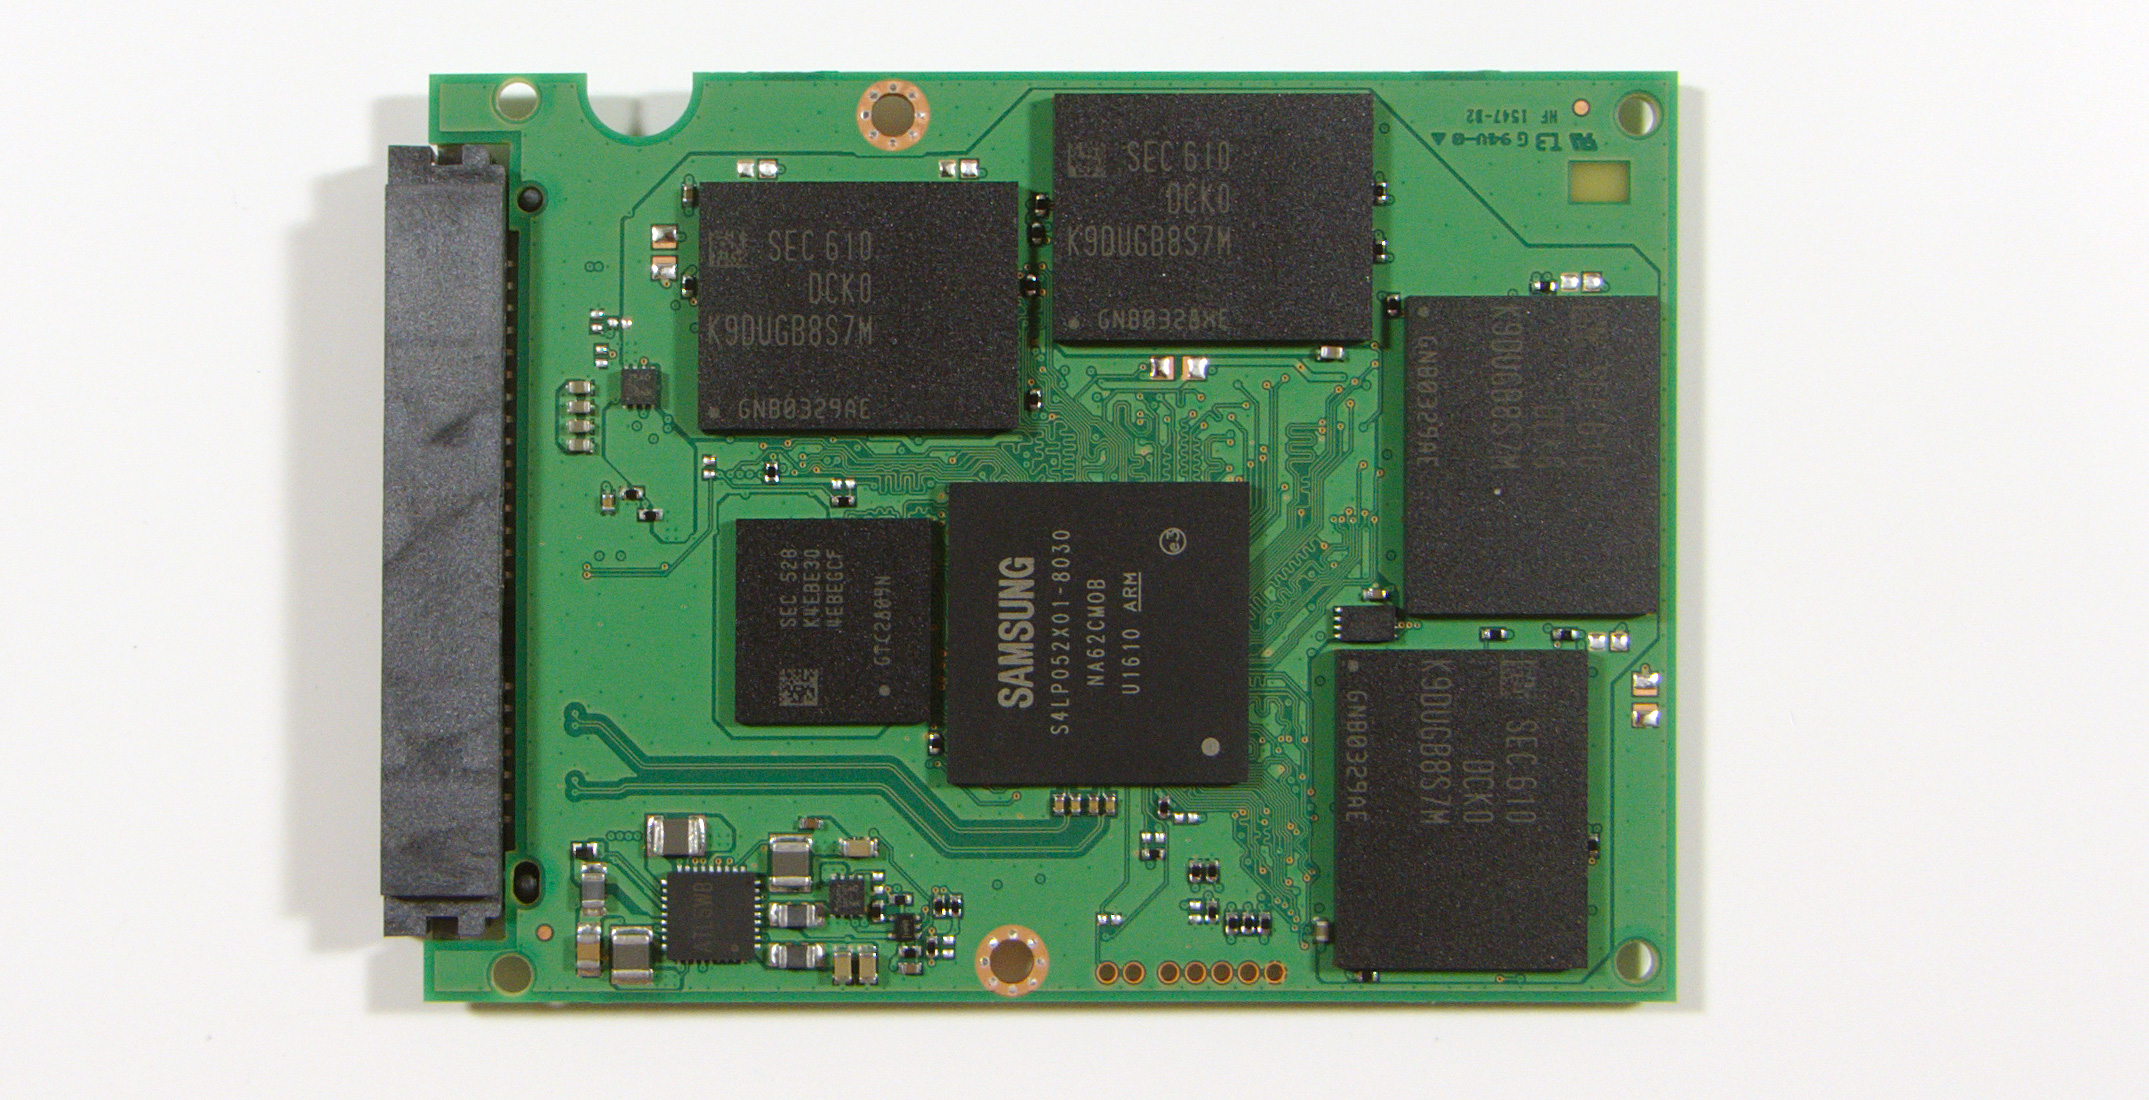
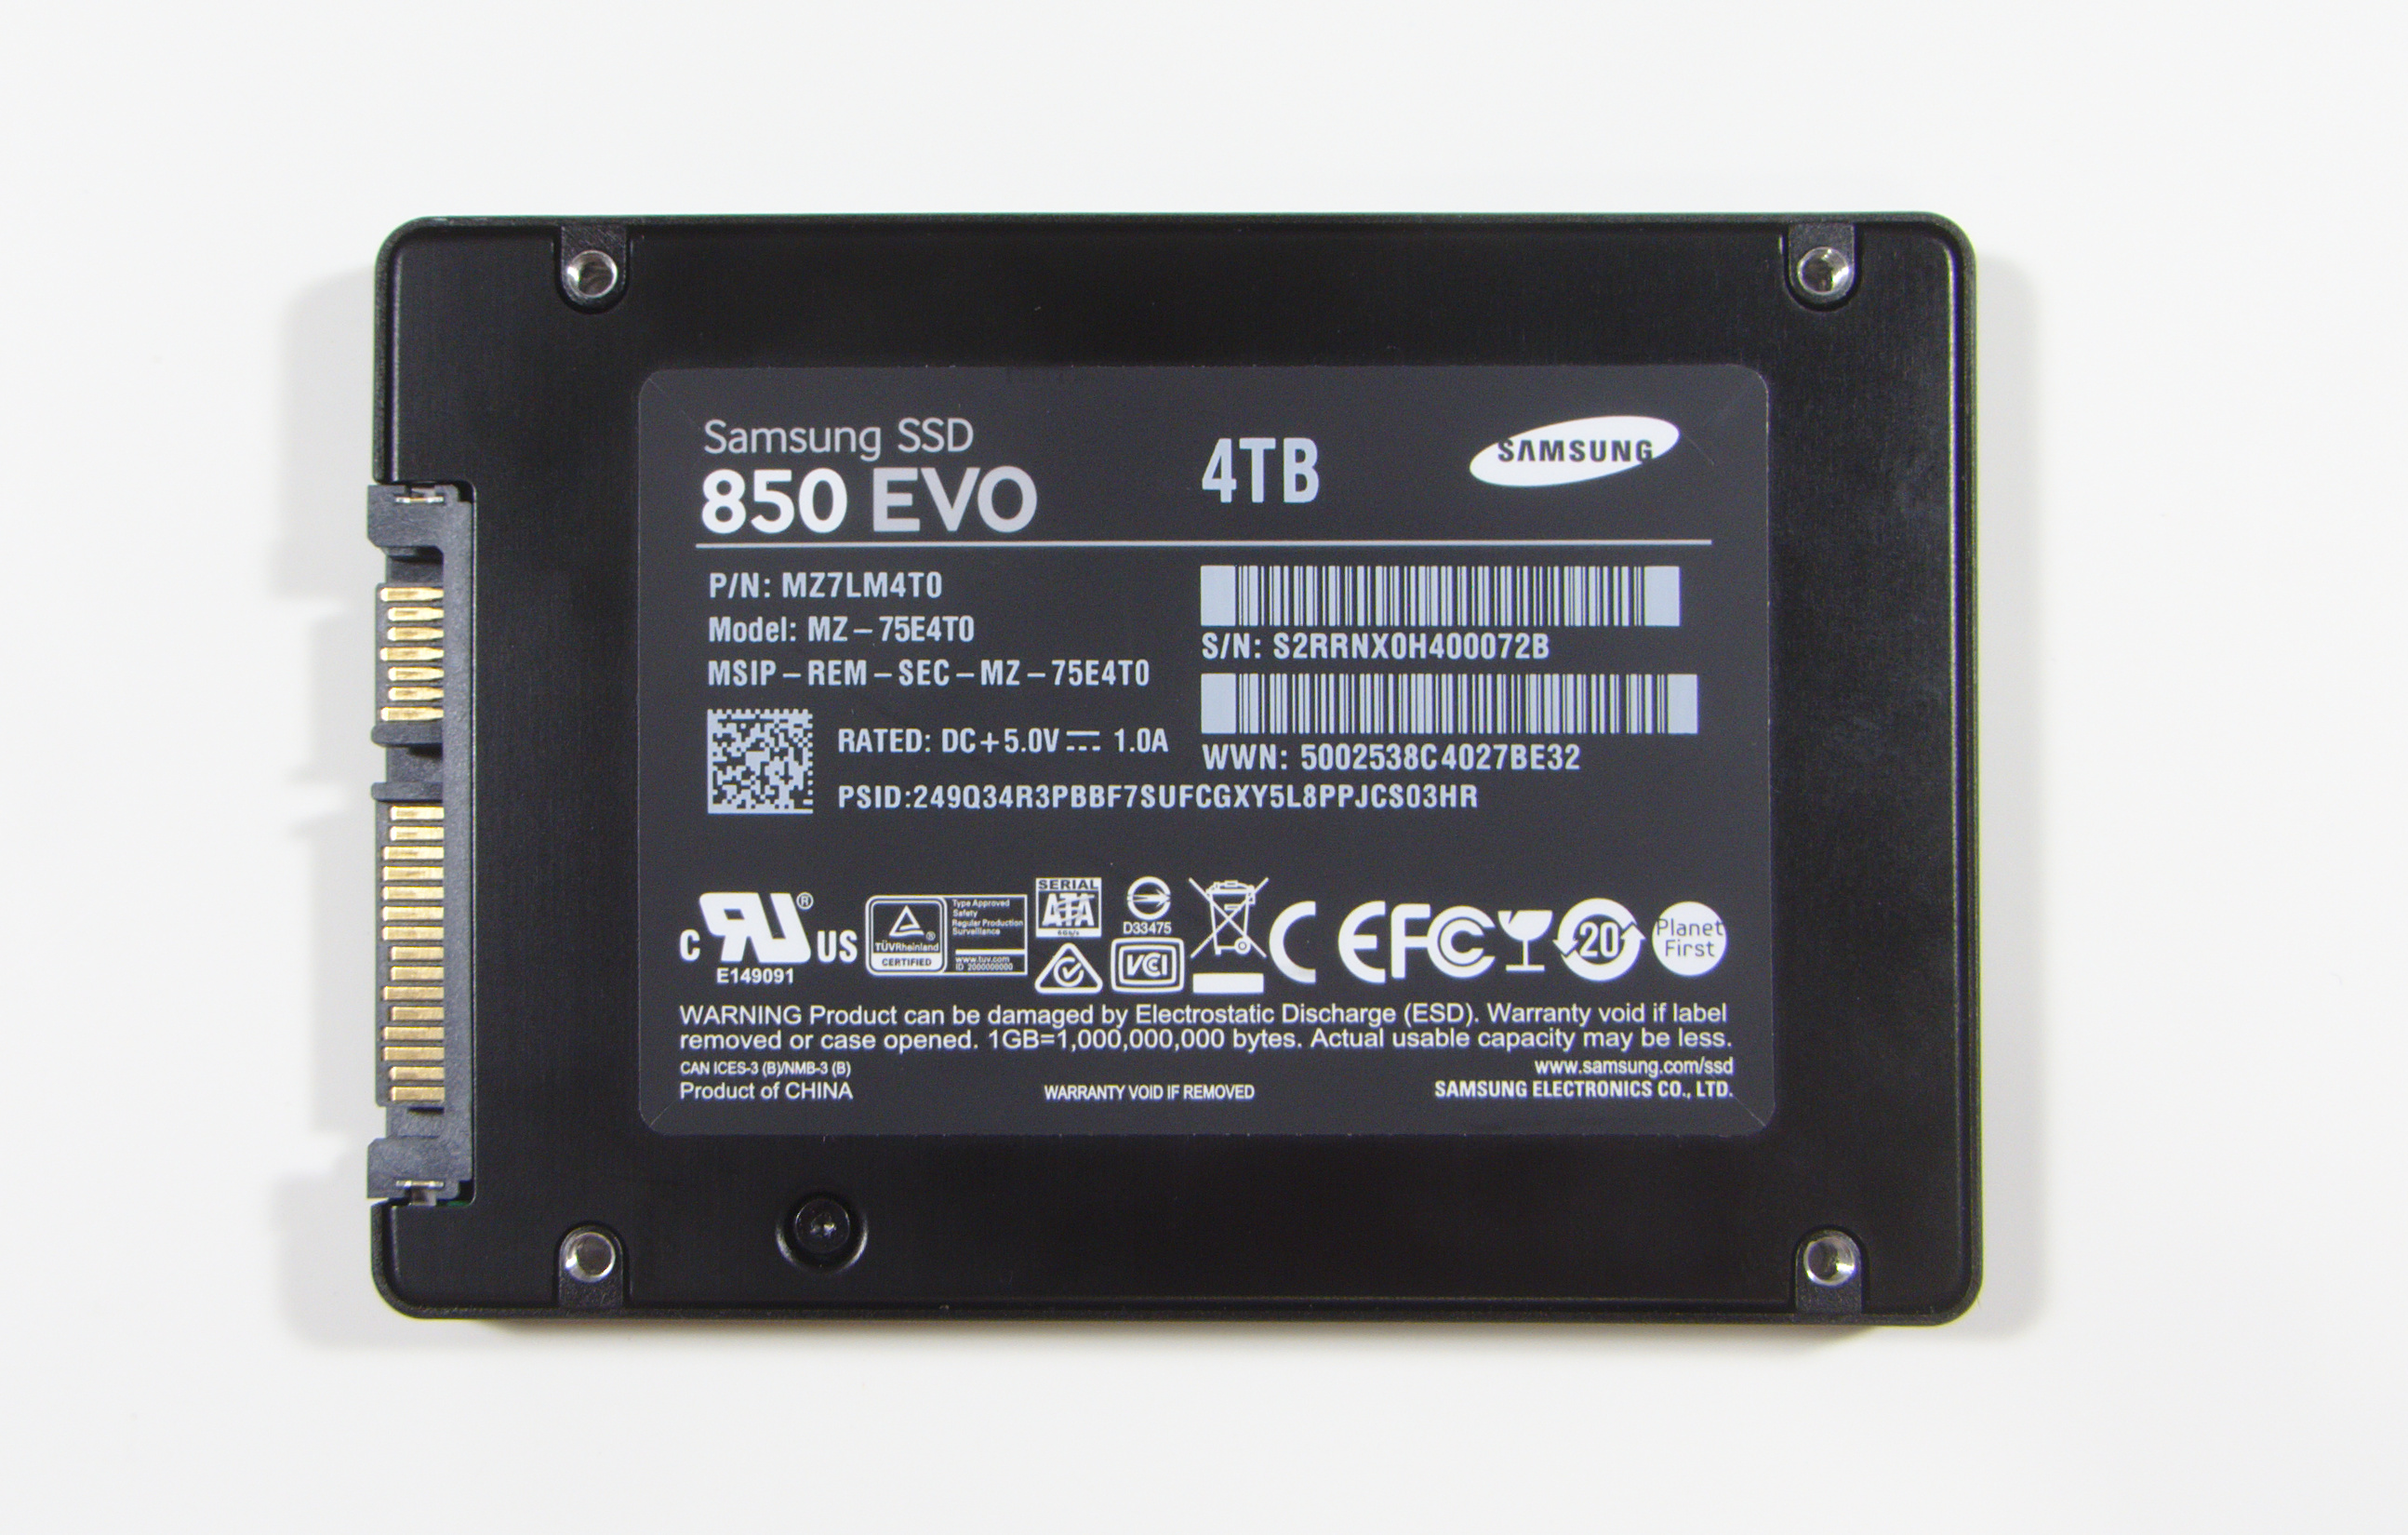
The 48-layer V-NAND is now coming to the 2.5" 850 EVO line in the form of a new 4TB model. It turns out that the MHX controller introduced for the 2TB models supports 4GB of DRAM, so the new 4TB 850 EVO only required changing the NAND, bumping up to a higher-capacity DRAM chip, and a firmware revision. The rest of the drive—controller, PCB, and case—are identical to the 2TB model. It is a general rule that larger SSDs tend to be faster, but as we saw when the 2TB 850s showed up, the SATA interface doesn't leave much room for improvement and the overhead of managing more flash can sometimes slightly hurt performance. It's no surprise then that the performance specifications of the 4TB model are identical to that of the 500GB, 1TB and 2TB models. The idle power consumption rating of the 4TB 850 EVO is slightly higher than the 2TB model (likely due to the increased DRAM), but the new V-NAND gives the 4TB 850 EVO substantially lower active power consumption ratings than any previous capacity.
| Samsung SSD 850 EVO Specifications | |||||||
| Capacity | 120GB | 250GB | 500GB | 1TB (1000GB) | 2TB (2000GB) | 4TB (4000GB) | |
| Controller | MGX | MHX | |||||
| NAND | Samsung 32-layer 128Gbit TLC V-NAND | Samsung 48-layer 256Gbit TLC V-NAND | |||||
| DRAM (LPDDR3) | 256MB | 512MB | 1GB | 2GB | 4GB | ||
| Sequential Read | 540MB/s | ||||||
| Sequential Write (max) | 520MB/s | ||||||
| Sequential Write (non-TurboWrite) | 150MB/s | 300MB/s | 500MB/s | ||||
| 4KB Random Read (QD32) | 94K IOPS | 97K IOPS | 98K IOPS | ||||
| 4KB Random Write (QD32) | 88K IOPS | 90K IOPS | |||||
| 4KB Random Read (QD1) | 10K IOPS | ||||||
| 4KB Random Write (QD1) | 38K IOPS | 40K IOPS | |||||
| DevSleep Power | 2mW | 2mW | 2mW | 4mW | 5mW | 10mW | |
| Slumber Power | 50mW | 60mW | 70mW | ||||
| Active Power (Read/Write) | 3.7W / 4.4W | 3.7W / 4.7W | 3.1W / 3.6W | ||||
| Encryption | AES-256, TCG Opal 2.0, IEEE-1667 (eDrive) | ||||||
| Endurance | 75TB | 150TB | 300TB | ||||
| Warranty | Five years | ||||||
The one disappointment in the specifications for the 4TB 850 EVO is the write endurance rating, still the same 300TB total as the 2TB model. A warranty that expires after only 75 drive writes is concerning even if the total bytes written quantity has been reasonable in the past. It can come across as an indication that Samsung lacks confidence in their new V-NAND, which is at odds with the 5-year warranty the drive carries. For comparison, Samsung's enterprise PM863 based on the older 32-layer TLC V-NAND has a three year warranty but a 5600TB endurance rating for its 3.84TB model. Fortunately, it appears that the write endurance rating of the 4TB 850 EVO is very conservative: the testing subjected it to a total of around 7 drive writes but the SMART lifetime indicator is down to only 99% rather than the 90 or 91% implied by the 300TBW rating.
Meanwhile thanks to TechInsights, we know a bit about what makes it possible for Samsung's third generation V-NAND to offer higher capacities that are both more power efficient and more cost-effective. In addition to raising the layer count from 32 to 48, Samsung has tweaked several aspects of the design. The NAND cells still use a charge-trap design (in contrast to the floating gate used by planar NAND flash), but with some dimensions reduced, an extra metal interconnect layer, and more compact logic and I/O regions on the die. The net effect is that density has increased from about 1.86 Gb/mm^2 for the 32-layer TLC to about 2.6 Gb/mm^2 for the 48-layer TLC in this 4TB 850 EVO.
Another trick up Samsung's sleeve is the use of F-Chips, an idea they presented at ISSCC 2015. The F-Chips serve a similar purpose to the buffers on FB-DIMMs for DRAM: rather than directly connect the SSD controller to a stack of NAND dies using a multidrop bus, the F-Chip is an interface chip that is connected to the SSD controller, and it in turn connects to two groups of four NAND dies. Because the tiny F-Chip inhabits the same BGA package as the stack of NAND and because its connections to the NAND are shared across only four chips instead of 8 or 16, maintaining signal integrity is much less of a problem. Likewise, the sharing of the bus between the NAND package and the SSD controller is reduced or eliminated.
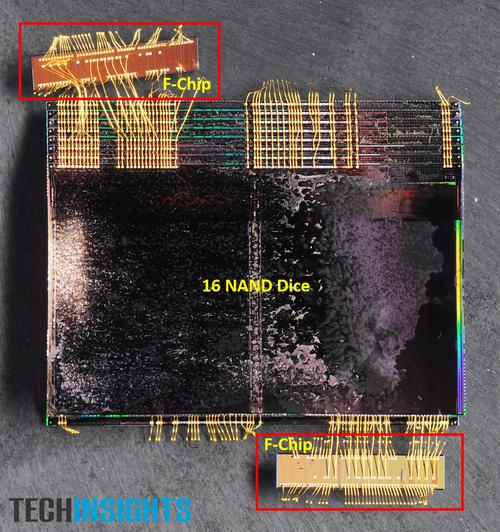
(Source: TechInsights via EETimes)
The original intent of this development was to allow for much higher throughput between the SSD controller and the NAND so that PCIe SSDs wouldn't need an extreme number of channels, but the reduced signal integrity concerns may have also allowed for some simplification of the I/O circuitry on the NAND chips. The F-Chip still presents a toggle-mode DDR interface to the SSD controller, so it is essentially transparent and doesn't require any controller modifications.
Given how SSD capacity is related to both performance and power consumption, we generally prefer to compare drives of similar capacities. The 4TB 850 EVO doesn't leave us any good options: most consumer SSD product lines still top out around 1TB, large enterprise SAS and PCIe SSDs wouldn't be a useful point of comparison and a RAID array of several smaller SATA SSDs wouldn't quite be fair either, and I don't even have a mechanical hard drive larger than 3TB handy. For now, the 4TB 850 EVO is in a class of its own. It should be joined soon by a 4TB 850 Pro, but other than that most of the competition will only be reaching 2TB capacities this year. For this review, the 4TB 850 EVO will be compared against the other capacities of Samsung 850 EVO and 850 Pro as well as the largest of several other SSD product lines that compete more directly against the smaller capacity 850 EVOs.
With a MSRP of $1499 (37.4¢/GB) the 4TB 850 EVO should not be significantly more expensive per-GB than the 2TB model, which carries only a modest premium over the most cost-effective 500GB and 1TB capacities. The total price may be shockingly high, but per gigabyte it is not unreasonable.
| AnandTech 2015 SSD Test System | |
| CPU | Intel Core i7-4770K running at 3.5GHz (Turbo & EIST enabled, C-states disabled) |
| Motherboard | ASUS Z97 Pro (BIOS 2701) |
| Chipset | Intel Z97 |
| Memory | Corsair Vengeance DDR3-1866 2x8GB (9-10-9-27 2T) |
| Graphics | Intel HD Graphics 4600 |
| Desktop Resolution | 1920 x 1200 |
| OS | Windows 8.1 x64 |
- Thanks to Intel for the Core i7-4770K CPU
- Thanks to ASUS for the Z97 Deluxe motherboard
- Thanks to Corsair for the Vengeance 16GB DDR3-1866 DRAM kit, RM750 power supply, Carbide 200R case, and Hydro H60 CPU cooler
Performance Consistency
Our performance consistency test explores the extent to which a drive can reliably sustain performance during a long-duration random write test. Specifications for consumer drives typically list peak performance numbers only attainable in ideal conditions. The performance in a worst-case scenario can be drastically different as over the course of a long test drives can run out of spare area, have to start performing garbage collection, and sometimes even reach power or thermal limits.
In addition to an overall decline in performance, a long test can show patterns in how performance varies on shorter timescales. Some drives will exhibit very little variance in performance from second to second, while others will show massive drops in performance during each garbage collection cycle but otherwise maintain good performance, and others show constantly wide variance. If a drive periodically slows to hard drive levels of performance, it may feel slow to use even if its overall average performance is very high.
To maximally stress the drive's controller and force it to perform garbage collection and wear leveling, this test conducts 4kB random writes with a queue depth of 32. The drive is filled before the start of the test, and the test duration is one hour. Any spare area will be exhausted early in the test and by the end of the hour even the largest drives with the most overprovisioning will have reached a steady state. We use the last 400 seconds of the test to score the drive both on steady-state average writes per second and on its performance divided by the standard deviation.
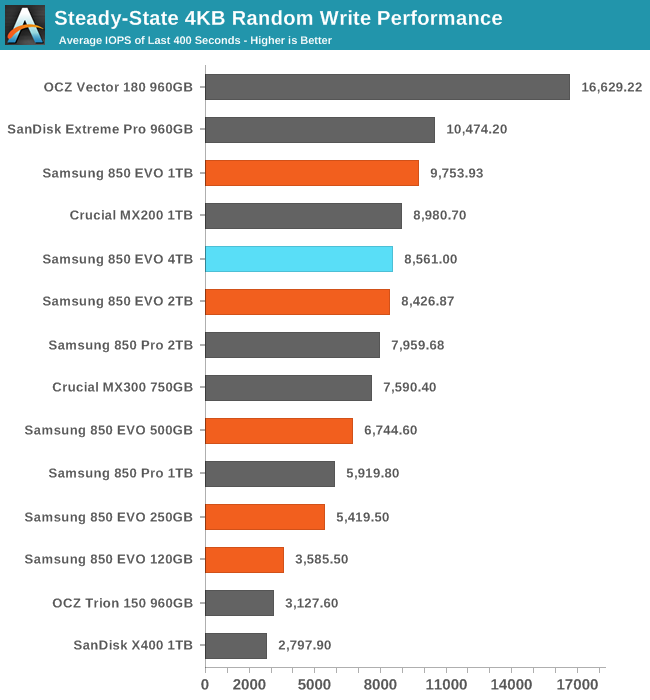
The 4TB 850 EVO restores a little bit of the performance that the 2TB lost relative to the 1TB, but Samsung's controller architecture is still clearly most comfortable at 1TB.
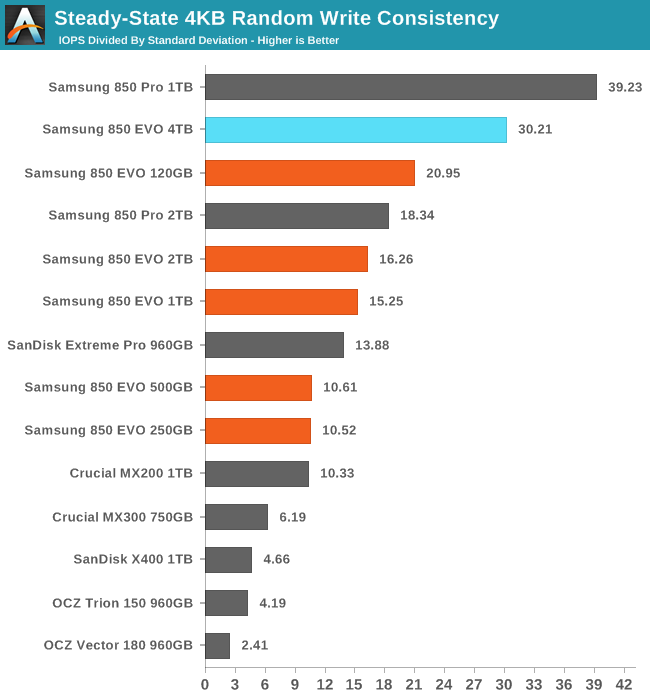
The consistency of the 2TB 850 EVO was only slightly better than the 1TB EVO, so it's surprising to see the 4TB model make such a large jump and come so close to the 1TB 850 Pro.
 |
|||||||||
| Default | |||||||||
| 25% Over-Provisioning | |||||||||
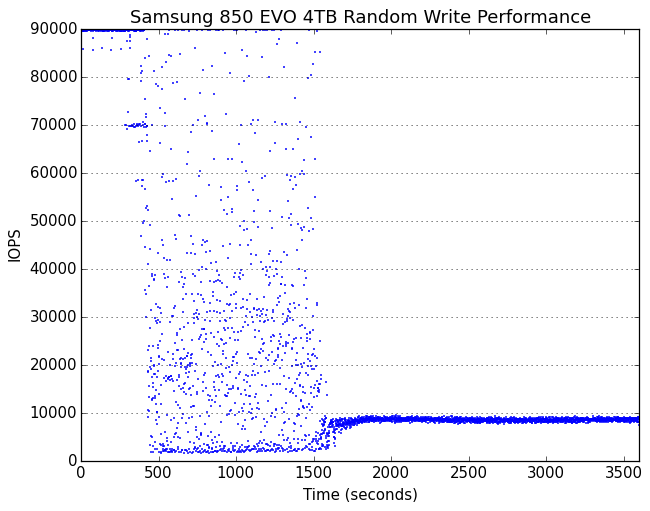
It is no surprise that a 4TB drive lasts so long before dropping out of peak performance: it has far more spare area to burn through than any ordinary consumer SATA SSD. The transition to steady state is uncharacteristically long and messy for a Samsung drive, and the performance lows during this period are disappointing. Once the drive has reached steady state, there's nothing to complain about.
 |
|||||||||
| Default | |||||||||
| 25% Over-Provisioning | |||||||||
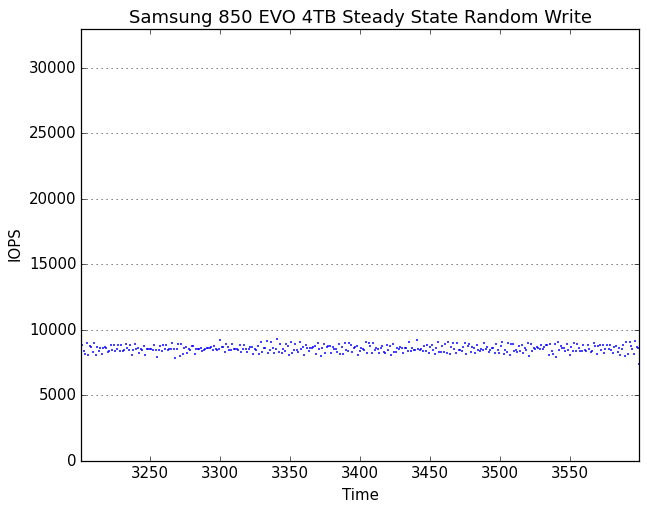
There are no wild outliers from the 4TB 850 EVO's steady-state, and none of the longer-term drift in performance shown by the 1TB and 2TB 850 EVO and Pro models. With extra overprovisioning, the 4TB EVO carries on indefinitely with high and extremely steady performance.
AnandTech Storage Bench - The Destroyer
The Destroyer is an extremely long test replicating the access patterns of very IO-intensive desktop usage. A detailed breakdown can be found in this article. Like real-world usage and unlike our Iometer tests, the drives do get the occasional break that allows for some background garbage collection and flushing caches, but those idle times are limited to 25ms so that it doesn't take all week to run the test.
We quantify performance on this test by reporting the drive's average data throughput, a few data points about its latency, and the total energy used by the drive over the course of the test.
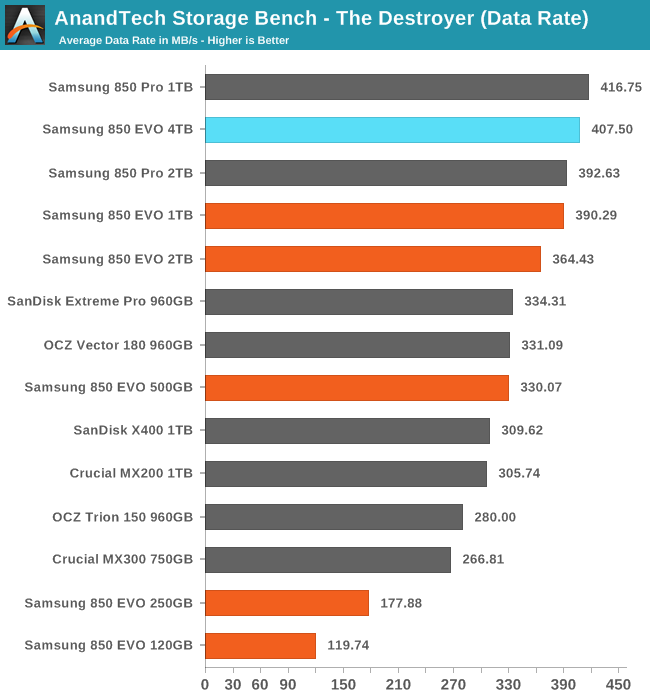
The Destroyer isn't enough to really challenge the 4TB 850 EVO, as this test doesn't write enough data to fill the drive even halfway. The 1TB 850 Pro still holds the record for the highest average data rate maintained by a SATA drive, but the 4TB EVO is closer to that than to any slower drive.
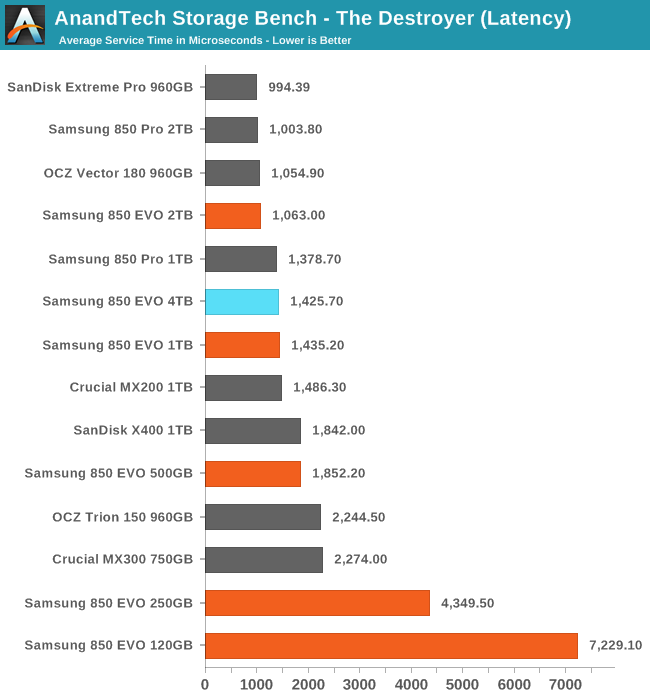
After the 2TB 850 Pro and EVO managed to tie with the top tier of drives for average service time, it is a little disappointing to see the 4TB 850 EVO only manages to match the 1TB models, but that's still high-end performance.
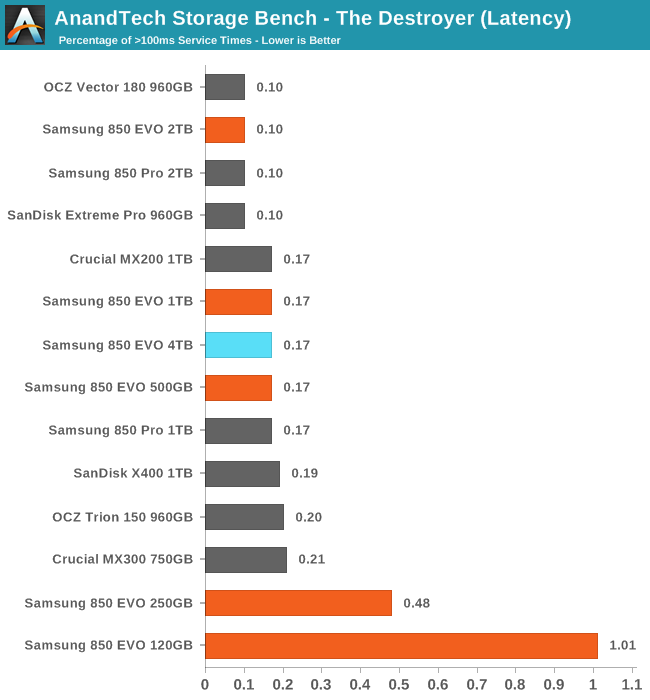
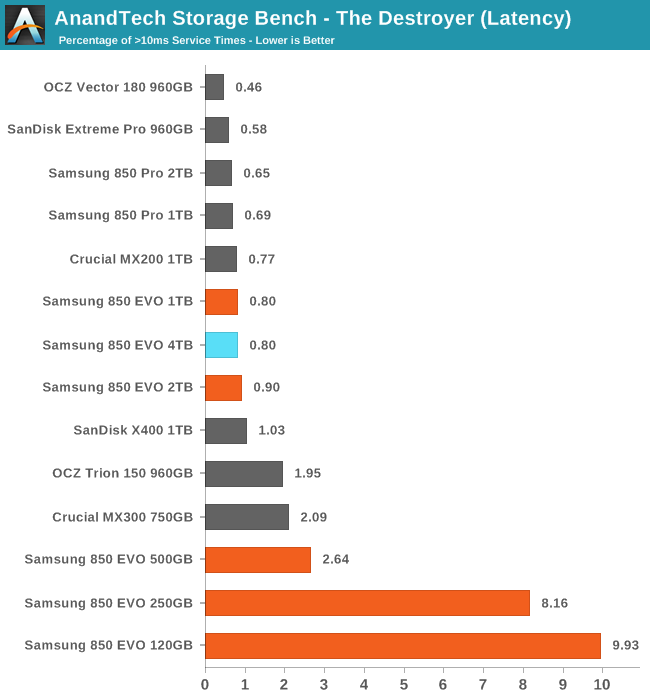
The 4TB 850 EVO has slightly more extreme latency outliers than the 2TB 850s, but at the more strict threshold of 10ms it is tied with the 1TB 850 EVO for being the best TLC drive.
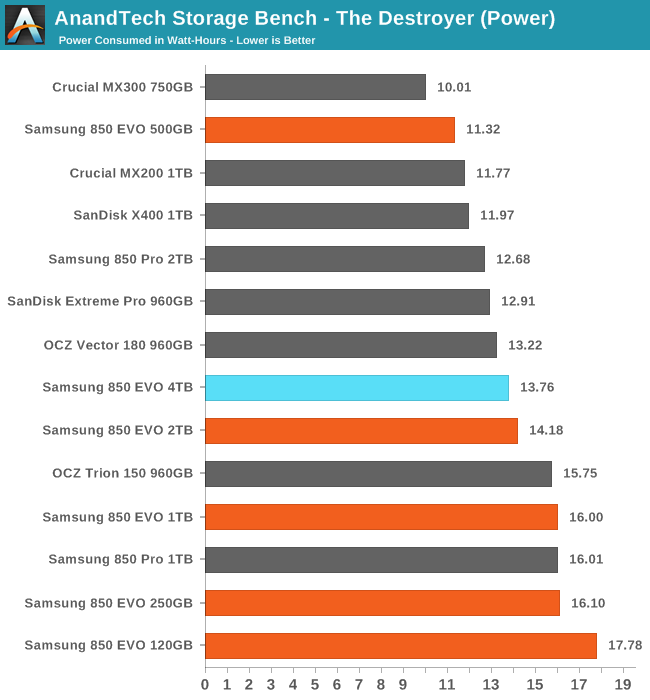
The 4TB 850 EVO brings a little more reduction in power use over the 2TB 850 EVO, which substantially cut power use relative to the 1TB model. The 4TB drive is clearly not paying any significant penalty for keeping so much flash and DRAM powered up.
AnandTech Storage Bench - Heavy
Our Heavy storage benchmark is proportionally more write-heavy than The Destroyer, but much shorter overall. The total writes in the Heavy test aren't enough to fill the drive, so performance never drops down to steady state. This test is far more representative of a power user's day to day usage, and is heavily influenced by the drive's peak performance. The Heavy workload test details can be found here.
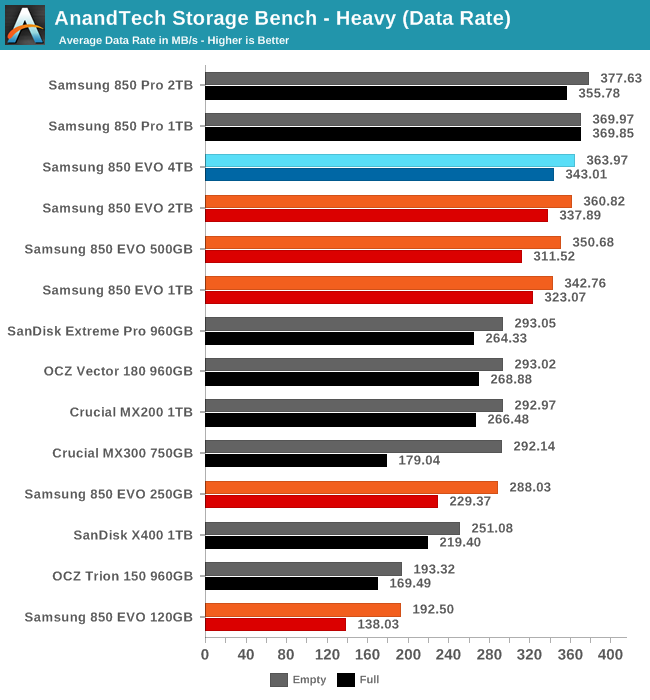
The 4TB 850 EVO is slightly faster overall on the Heavy test than the 2TB 850 EVO, so it takes over as the fastest TLC drive. The 1TB and 2TB 850 Pros are only a little faster.
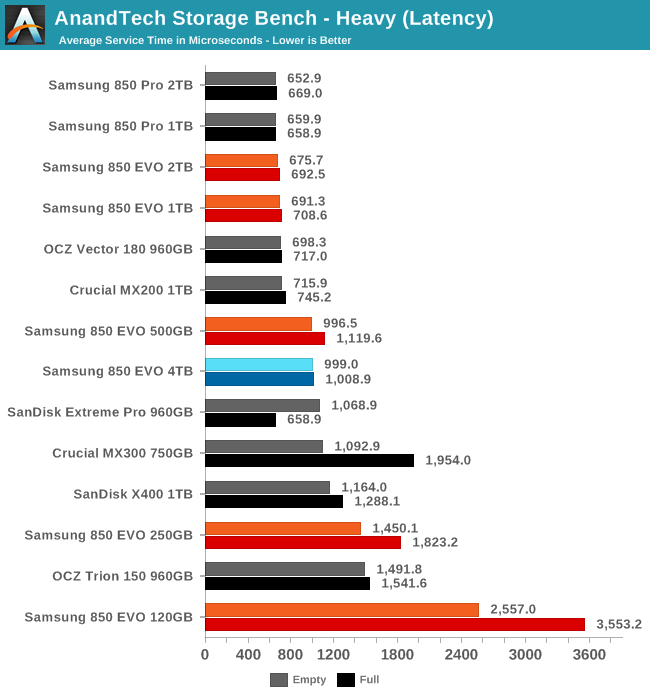
Average service time of the 4TB 850 EVO has regressed somewhat compared to the 1TB and 2TB models, but it still can't be beat by TLC from anybody other than Samsung.
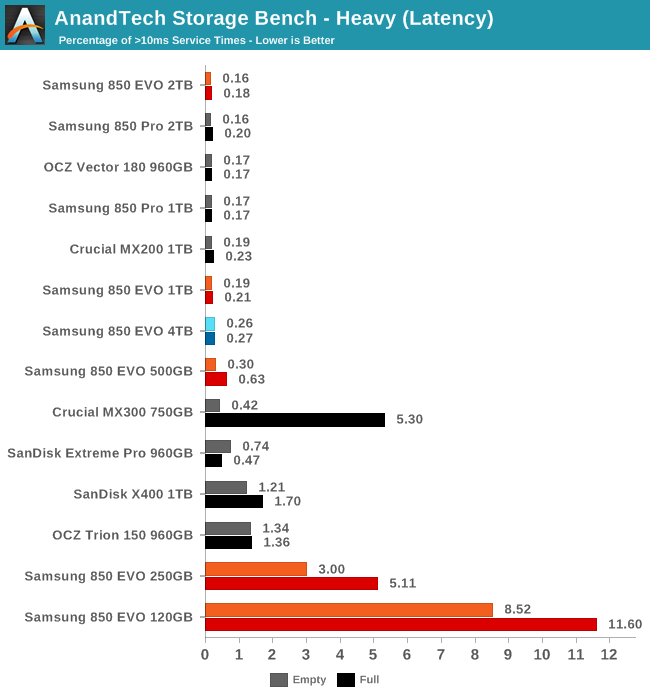
The quantity of latency outliers experienced by the 4TB 850 EVO places it at the bottom of the highest tier of drives and below the 1TB and 2TB models.
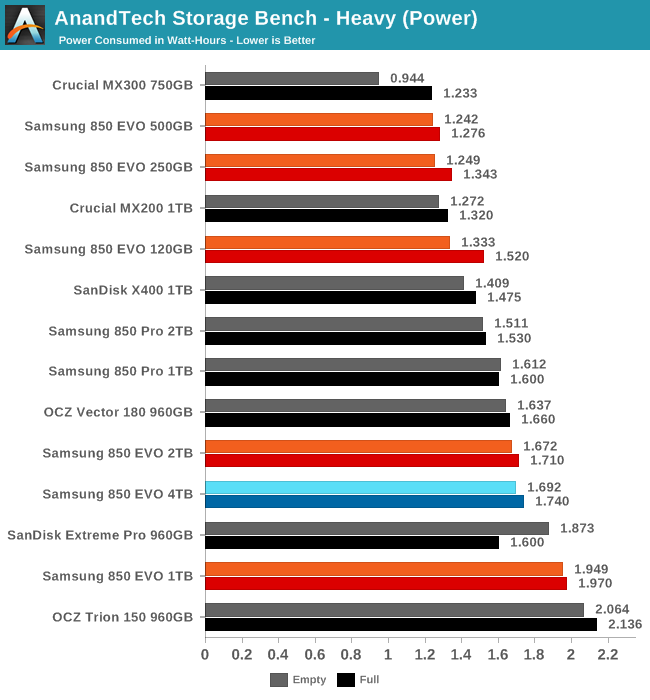
The 4TB 850 EVO uses very slightly more power than the 2TB, but both are much more efficient than the 1TB model and score reasonably well given the high capacity.
AnandTech Storage Bench - Light
Our Light storage test has relatively more sequential accesses and lower queue depths than The Destroyer or the Heavy test, and it's by far the shortest test overall. It's based largely on applications that aren't highly dependent on storage performance, so this is a test more of application launch times and file load times. This test can be seen as the sum of all the little delays in daily usage, but with the idle times trimmed to 25ms it takes less than half an hour to run. Details of the Light test can be found here.
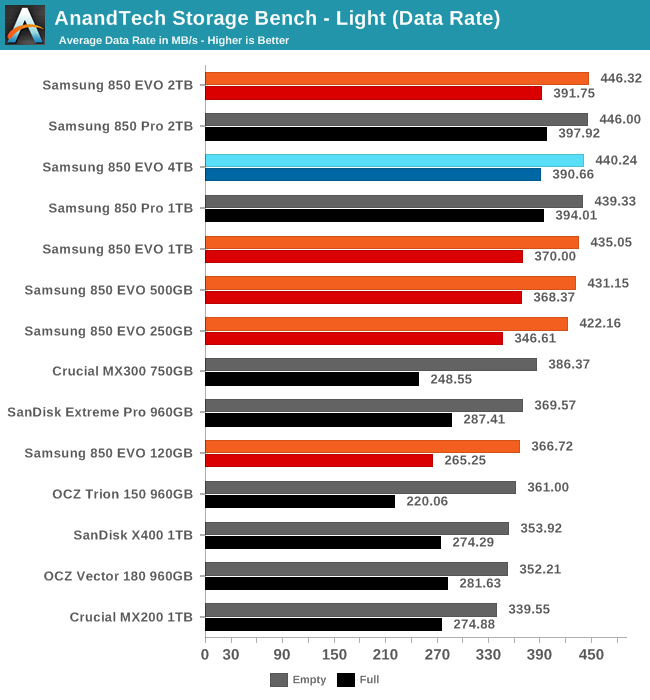
The 4TB 850 EVO is in a four-way tie for highest average data rate, and the Samsung drives in general score very well and quite close to the SATA interface limits.
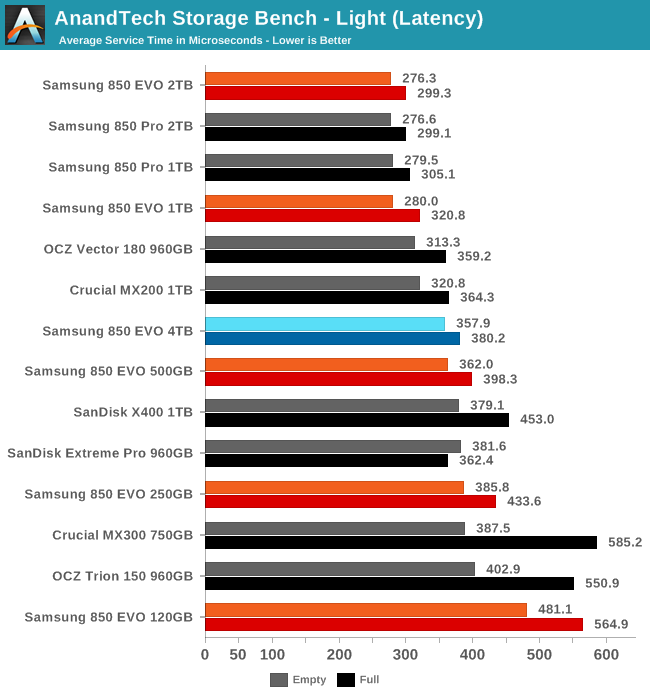
The 4TB 850 EVO's average service time is not top notch, but is still reasonable for a high-end SATA drive.
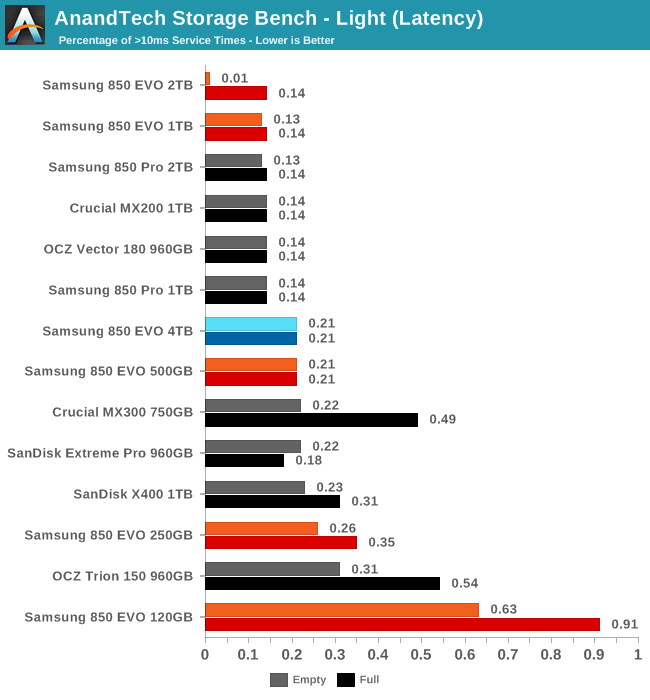
Once again the latency of the 4TB isn't the best and isn't quite as good as the 1TB and 2TB counterparts, but it's still better than all the other TLC drives.
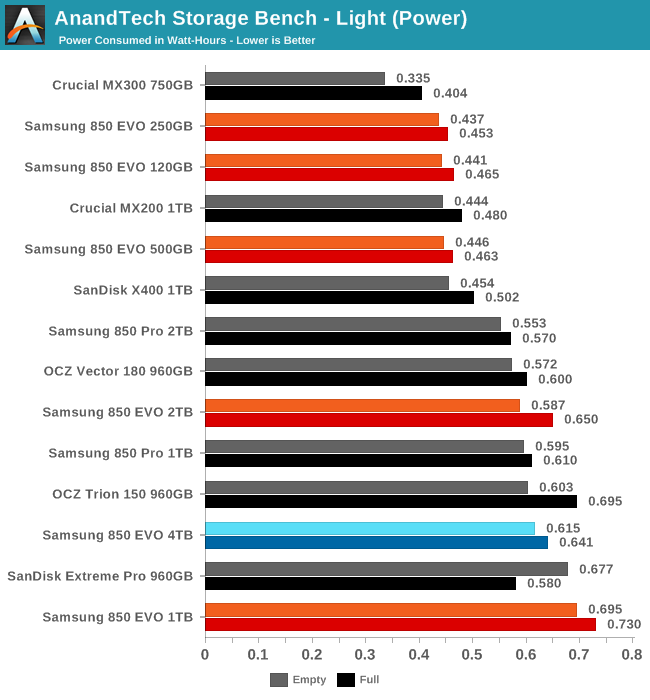
The power usage of the 4TB EVO is a bit worse than the 2TB model when fresh but is slightly better for a full drive, showing that this drive isn't worth having if you're barely going to use it.
Random Read Performance
The random read test requests 4kB blocks and tests queue depths ranging from 1 to 32. The queue depth is doubled every three minutes, for a total test duration of 18 minutes. The test spans the entire drive, which is filled before the test starts. The primary score we report is an average of performances at queue depths 1, 2 and 4, as client usage typically consists mostly of low queue depth operations.
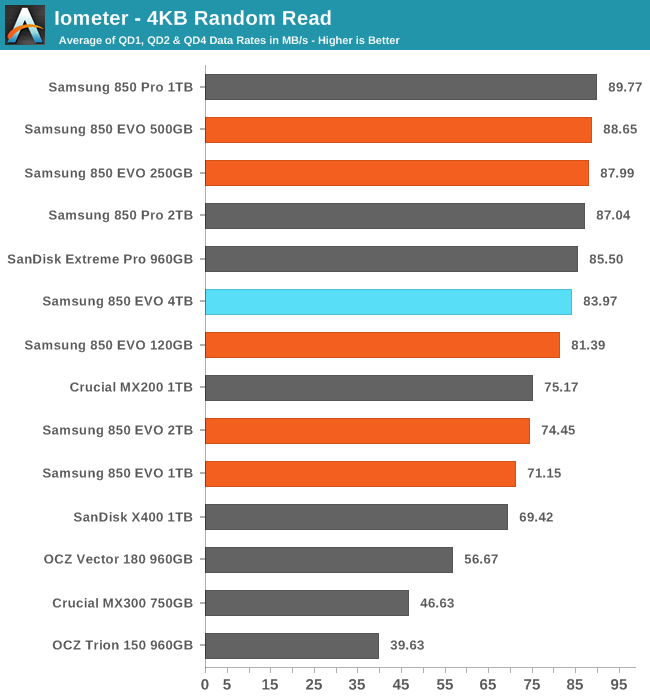
Random read performance of the 4TB 850 EVO is substantially better than the 1TB and 2TB 850 EVOs, but still not quite as fast as the best MLC drives or the 500GB and 250GB 850 EVOs.
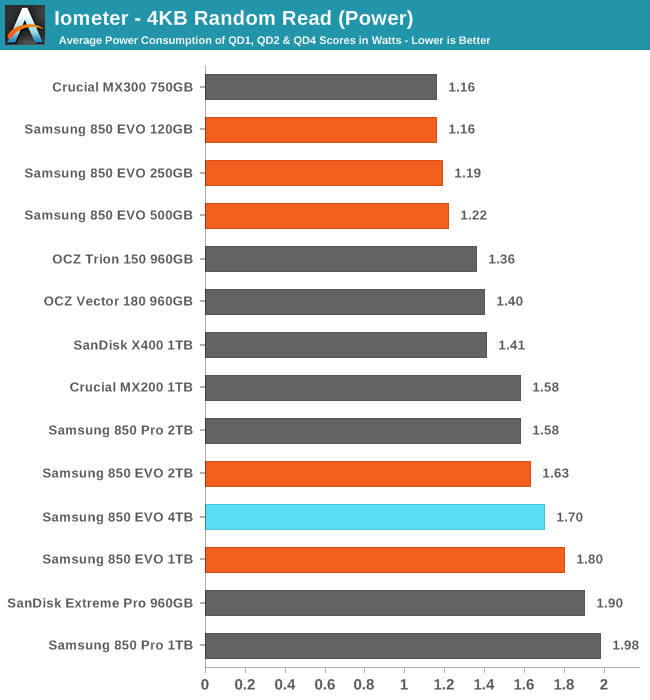
The power consumption of the 4TB 850 EVO is slightly higher than the 2TB model, but overall the efficiency is improved over the smaller drive with the same controller but older NAND.
 |
|||||||||
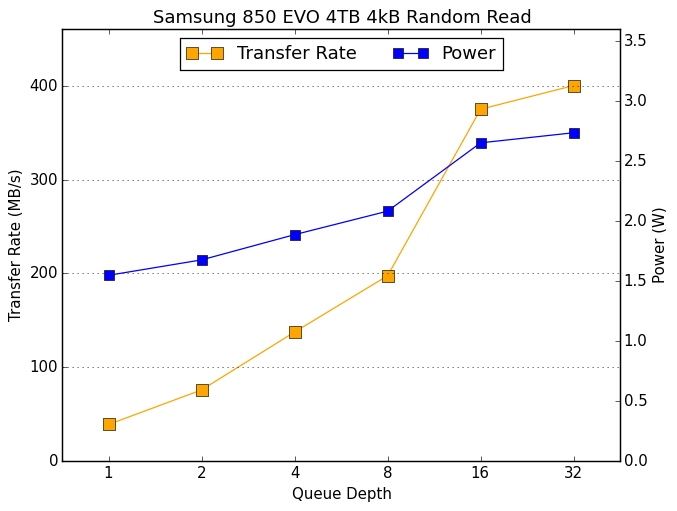
The scaling behavior of the 4TB 850 EVO is almost identical to the 2TB model, just with slightly higher performance and power consumption across the board.
Random Write Performance
The random write test writes 4kB blocks and tests queue depths ranging from 1 to 32. The queue depth is doubled every three minutes, for a total test duration of 18 minutes. The test is limited to a 16GB portion of the drive, and the drive is empty save for the 16GB test file. The primary score we report is an average of performances at queue depths 1, 2 and 4, as client usage typically consists mostly of low queue depth operations.
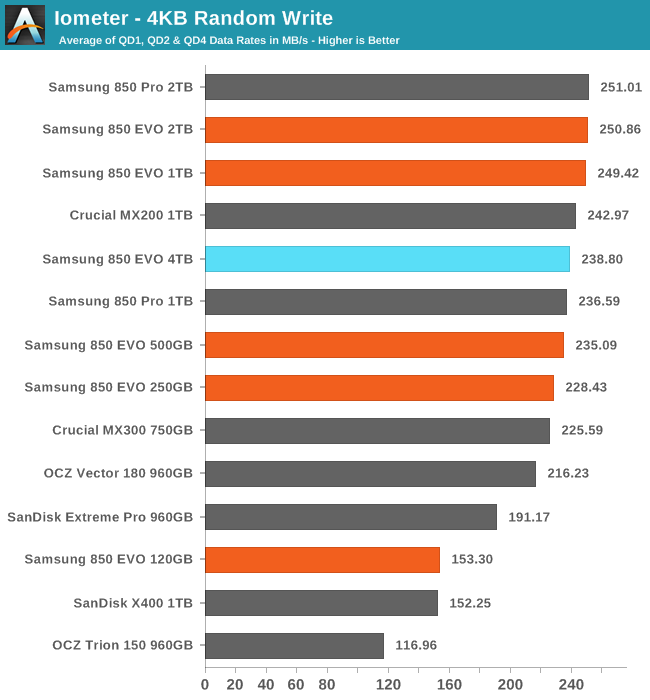
Random write speed for the 4TB 850 EVO is a little bit slower than for the 1TB and 2TB models, but still fast enough to beat almost all non-Samsung drives.
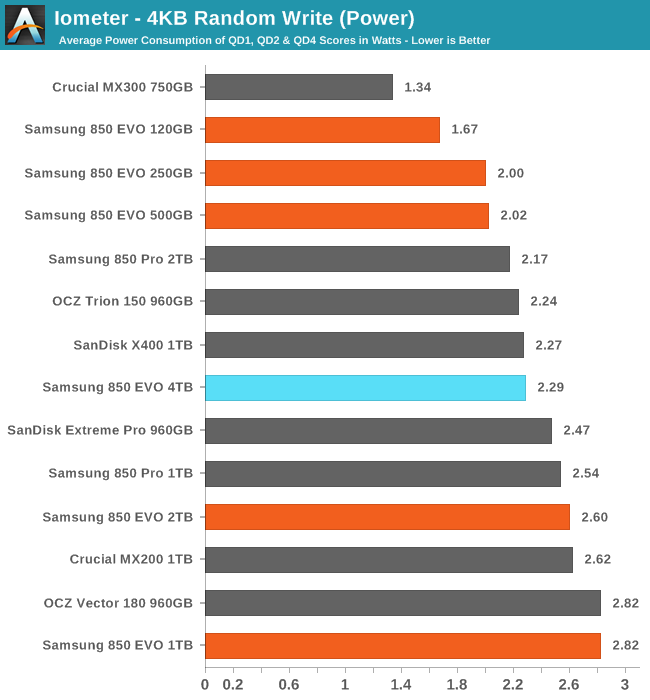
Power consumption of the 4TB 850 EVO is substantially better than the 1TB and 2TB counterparts, making it one of the most efficient large drives. The 750GB Crucial MX300 was still much more efficient.
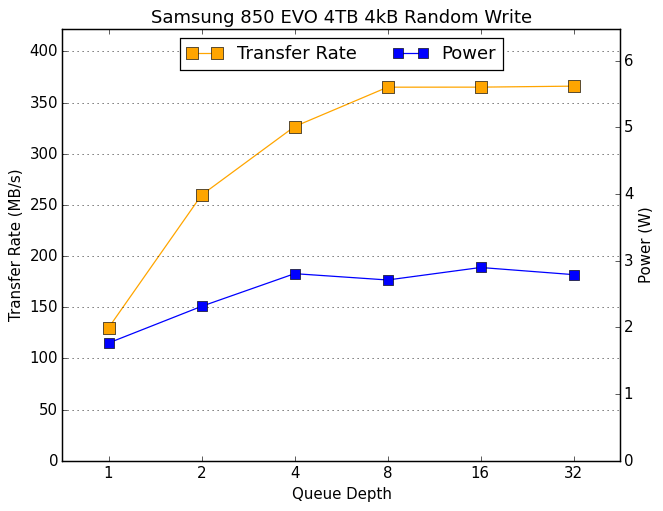 |
|||||||||
The lower performance score for the 4TB was apparently due to a regression in QD4 performance, where the 1TB and 2TB models were able to reach full speed but the 4TB needs a larger queue.
Sequential Read Performance
The sequential read test requests 128kB blocks and tests queue depths ranging from 1 to 32. The queue depth is doubled every three minutes, for a total test duration of 18 minutes. The test spans the entire drive, and the drive is filled before the test begins. The primary score we report is an average of performances at queue depths 1, 2 and 4, as client usage typically consists mostly of low queue depth operations.
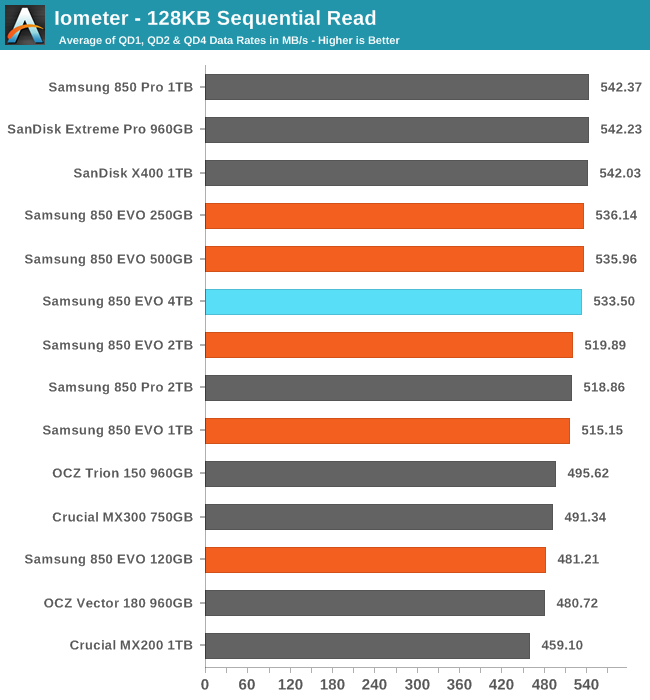
The 4TB 850 EVO scores slightly better than the 2TB for sequential reads, but it is still a hair slower than the fastest drives.
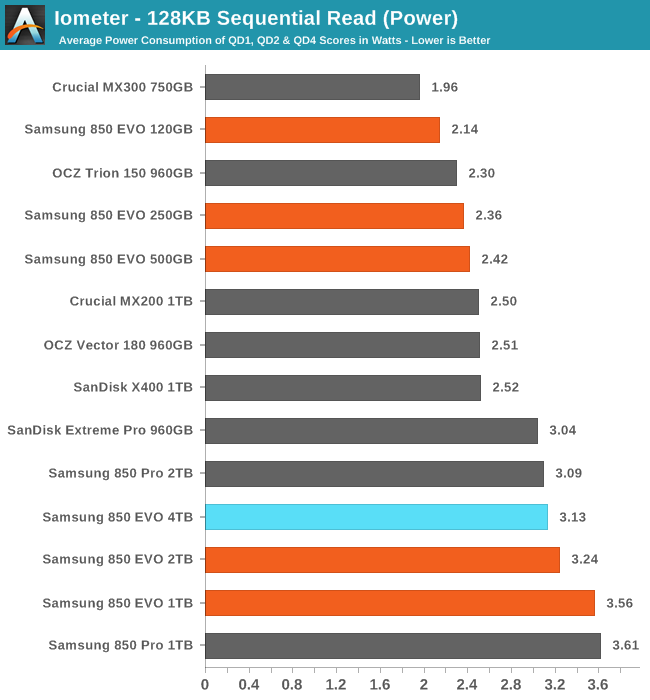
Samsung's large drives draw a lot of power during the sequential read test, but at least the 4TB 850 EVO improves over the 2TB and 1TB 850 EVOs.
 |
|||||||||
The 4TB 850 EVO does not suffer from the modestly impaired QD1 performance of the 2TB model, but for the rest of the test the 4TB is slightly slower than the other two.
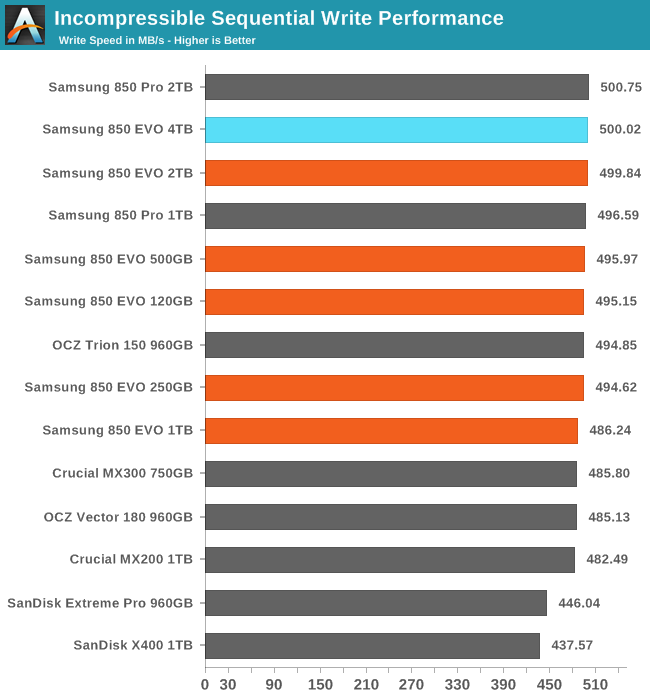
Sequential Write Performance
The sequential write test writes 128kB blocks and tests queue depths ranging from 1 to 32. The queue depth is doubled every three minutes, for a total test duration of 18 minutes. The test spans the entire drive, and the drive is filled before the test begins. The primary score we report is an average of performances at queue depths 1, 2 and 4, as client usage typically consists mostly of low queue depth operations.
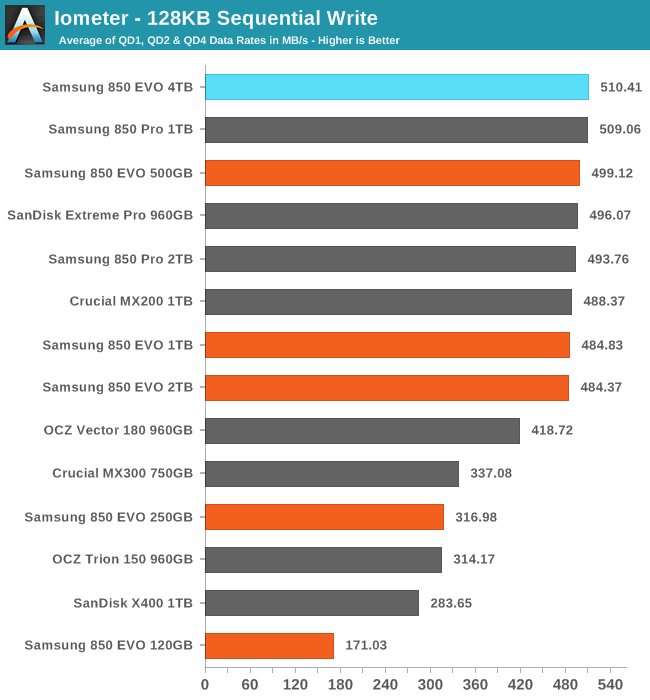
The 4TB 850 EVO manages to just barely break the record of the 1TB 850 Pro for the fastest sequential write speeds at low queue depths.
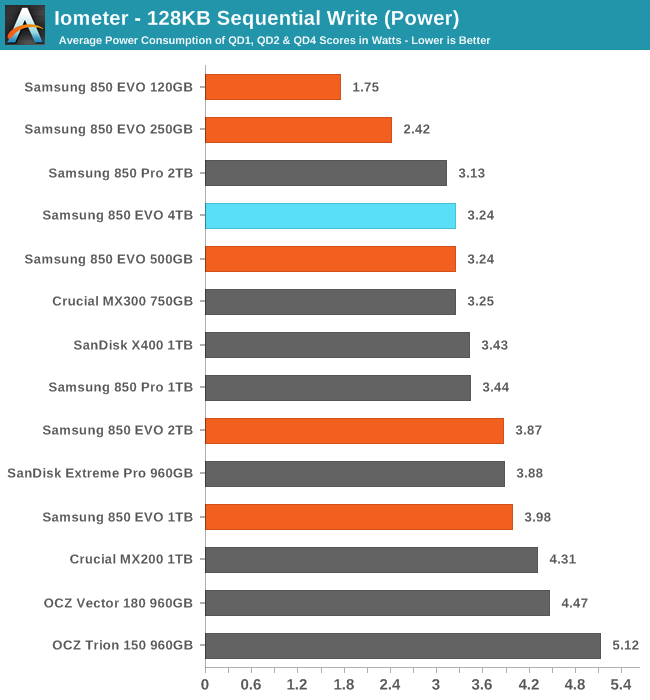
With the fastest performance and the fourth-lowest power usage, the 4TB comes out on top for efficiency.
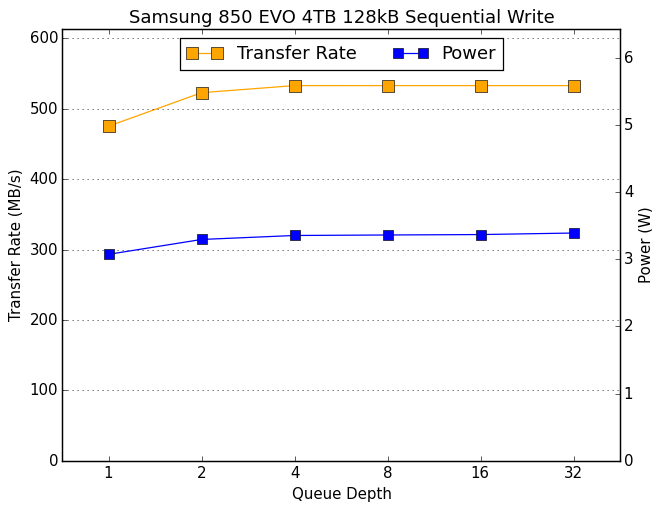 |
|||||||||
The 4TB 850 EVO shows substantially better QD1 performance and slightly better QD2 performance than the 2TB 850 EVO while having power consumption that is more in line with the 850 Pro.
Mixed Random Read/Write Performance
The mixed random I/O benchmark starts with a pure read test and gradually increases the proportion of writes, finishing with pure writes. The queue depth is 3 for the entire test and each subtest lasts for 3 minutes, for a total test duration of 18 minutes. As with the pure random write test, this test is restricted to a 16GB span of the drive, which is empty save for the 16GB test file.
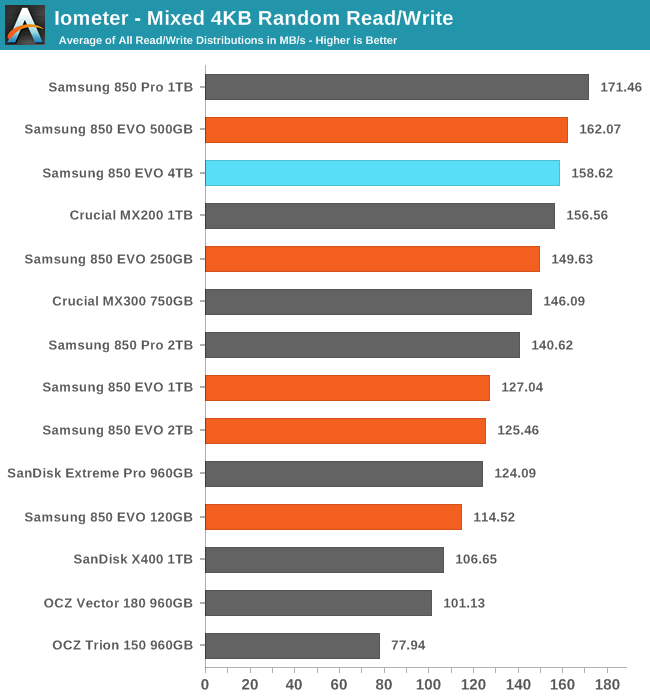
The mixed random I/O performance of the 4TB 850 EVO is much better than the other large 850 EVOs, putting te 4TB model close to the top of the chart.
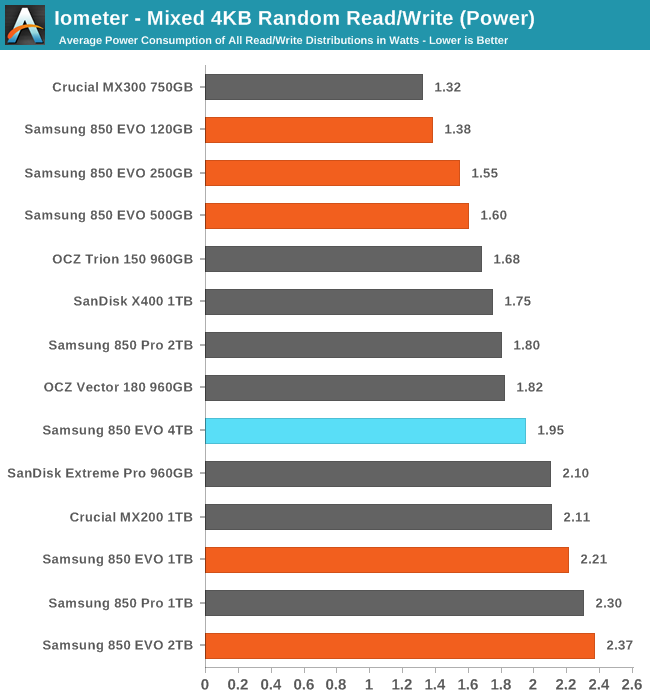
The 4TB 850 EVO also manages a large reduction in power usage as compared with the 1TB and 2TB 850 EVOs, making the 4TB much more efficient.
 |
|||||||||
Unlike the other 850 EVOs, the 4TB never loses performance as the proportion of writes in the test workload increases. Meanwhile, the power draw is essentially constant until near the end of the test.
Mixed Sequential Read/Write Performance
The mixed sequential access test covers the entire span of the drive and uses a queue depth of one. It starts with a pure read test and gradually increases the proportion of writes, finishing with pure writes. Each subtest lasts for 3 minutes, for a total test duration of 18 minutes. The drive is filled before the test starts.
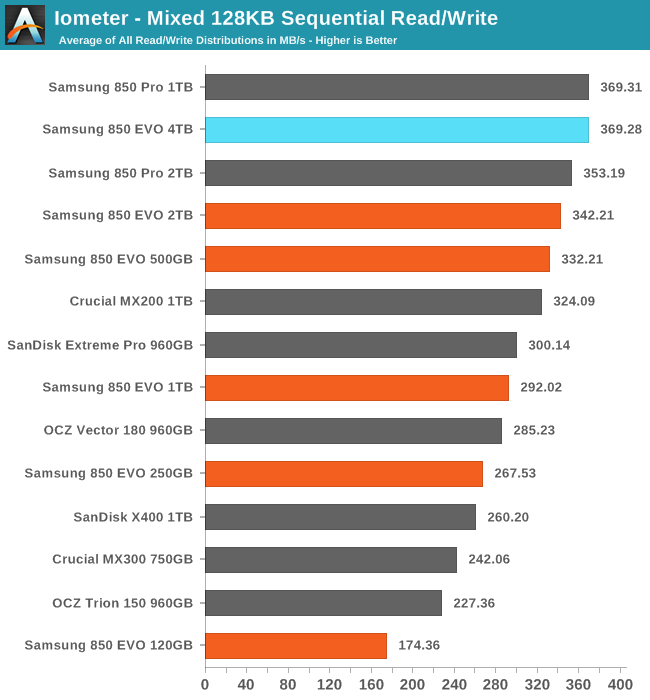
The 4TB 850 EVO is essentially tied for the best mixed sequential read and write performance.
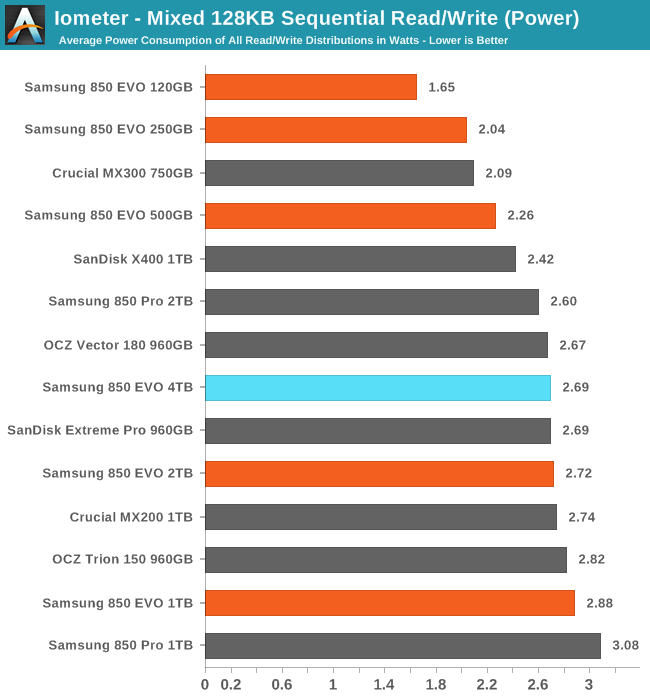
The 4TB 850 EVO averages using slightly less power than the 2TB model, and it is one of the most efficient of the large drives.
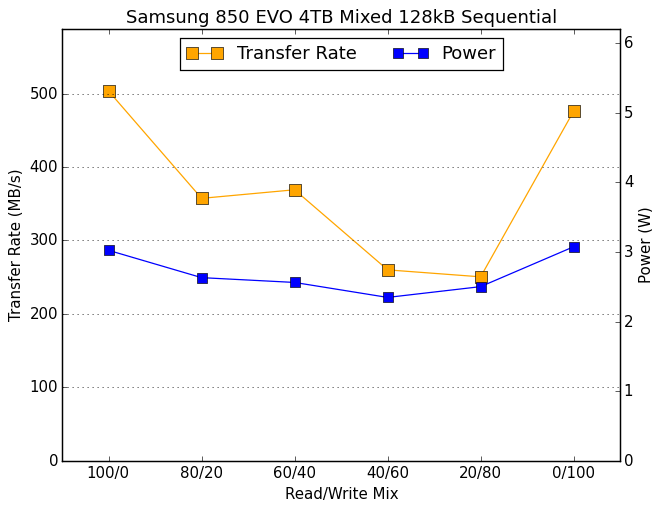 |
|||||||||
The usual pattern is for performance on this test to resemble a bathtub curve, but the 2TB 850s and the 4TB 850 EVO don't lose as much of their performance during the first half of the test, leading them to bottom out much later than most other drives.
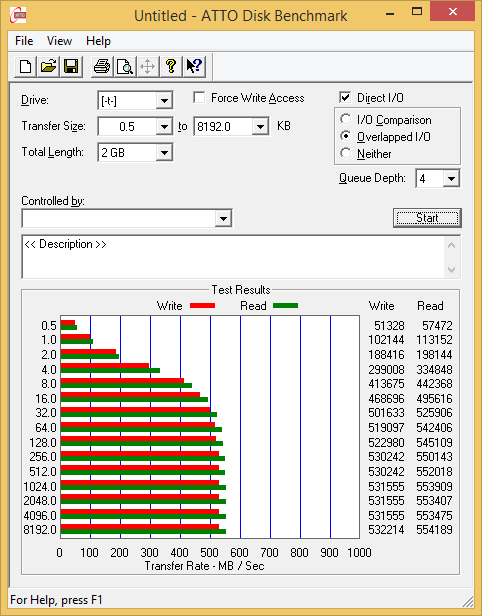
ATTO
ATTO's Disk Benchmark is a quick and easy freeware tool to measure drive performance across various transfer sizes.
 |
|||||||||
The ATTO plot for the 4TB 850 EVO shows no problems and very slightly better read speeds than the 2TB 850 EVO.
AS-SSD
AS-SSD is another quick and free benchmark tool. It uses incompressible data for all of its tests, making it an easy way to keep an eye on which drives are relying on transparent data compression. The short duration of the test makes it a decent indicator of peak drive performance.
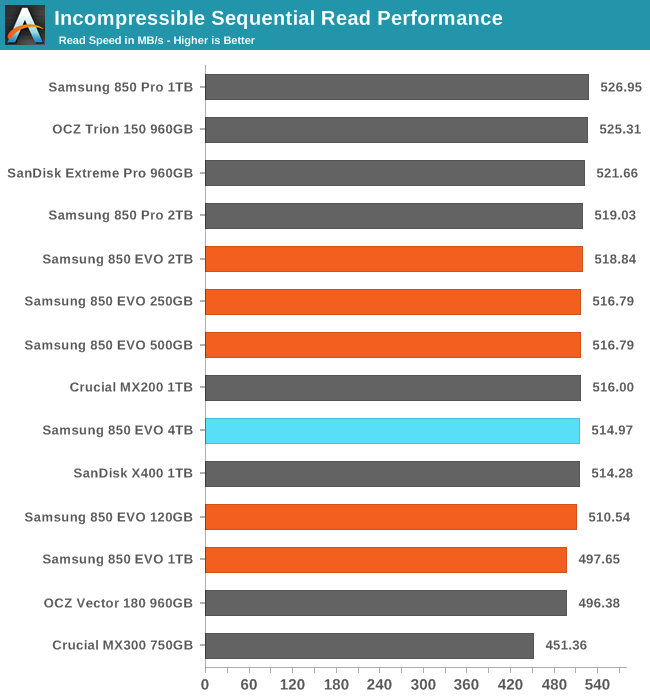
As expected, the AS-SSD results are unremarkable. Even if the new V-NAND were slower, the 4TB drive has more than enough parallelism to provide peak performance that saturates the SATA link.
Idle Power Consumption
Since the ATSB tests based on real-world usage cut idle times short to 25ms, their power consumption scores paint an inaccurate picture of the relative suitability of drives for mobile use. During real-world client use, a solid state drive will spend far more time idle than actively processing commands. Our testbed doesn't support the deepest DevSlp power saving mode that SATA drives can implement, but we can measure the power usage in the intermediate slumber state where both the host and device ends of the SATA link enter a low-power state and the drive is free to engage its internal power savings measures.
We also report the drive's idle power consumption while the SATA link is active and not in any power saving state. Drives are required to be able to wake from the slumber state in under 10 milliseconds, but that still leaves plenty of room for them to add latency to a burst of I/O. Because of this, many desktops default to either not using SATA Aggressive Link Power Management (ALPM) at all or to only enable it partially without making use of the device-initiated power management (DIPM) capability. Additionally, SATA Hot-Swap is incompatible with the use of DIPM, so our SSD testbed usually has DIPM turned off during performance testing.
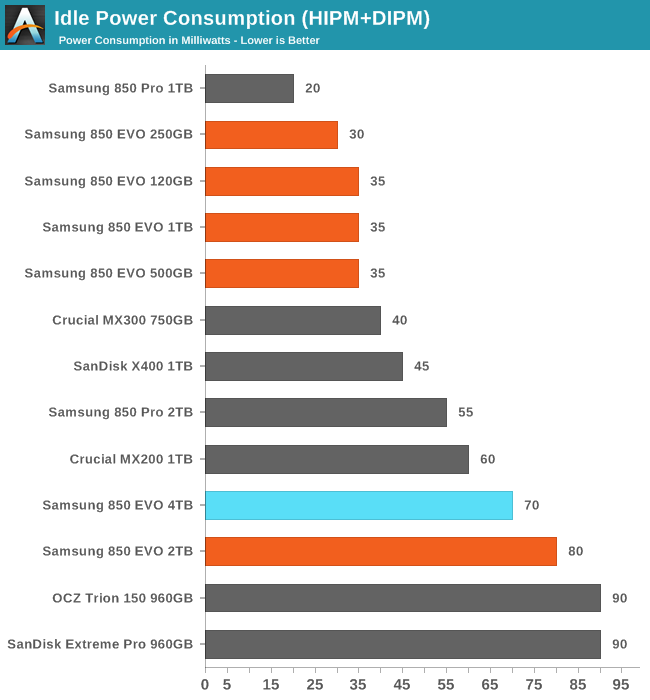
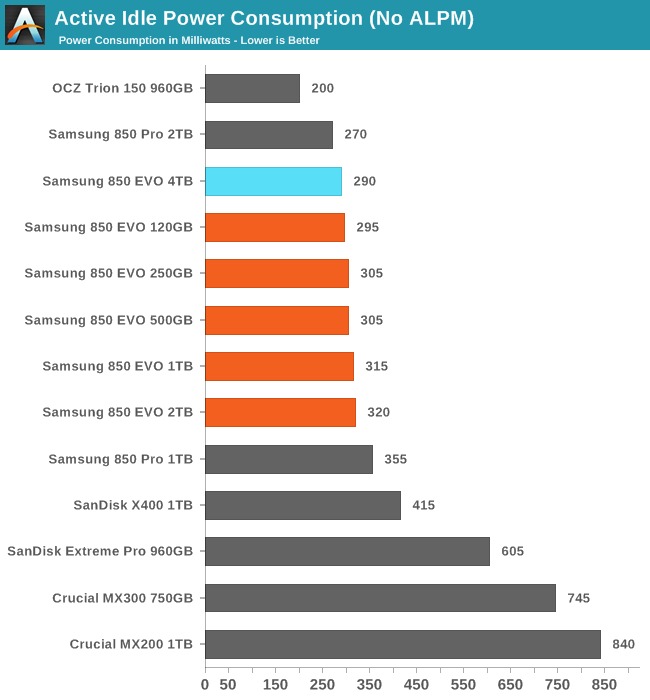
The 4TB EVO has slightly lower idle power consumption than the 2TB EVO, but both still draw twice as much power in the slumber state as the smaller 850 EVOs with the MEX and MGX controllers.
Final Words
The 4TB Samsung 850 EVO set new highs for a few performance sub-tests, but ultimately the only important record it breaks is for its storage capacity. On that front it is without equal in the consumer market and even among enterprise SATA drives higher capacities are only available from drives that are more than 7mm thick.
Samsung's new 256Gb 48-layer V-NAND chips made it straightforward for them to create this product, but it doesn't quite seem necessary. We were already quite impressed with their 2TB drives, and they still don't face any serious competition. The 4TB 850 EVO is a stark illustration of Samsung's seemingly insurmountable lead in the marketplace, but it is far too expensive for any ordinary desktop or NAS use. There simply aren't many consumers who can afford this much SSD, but if you're a consumer with the budget for 4TB of SSD storage the 850 EVO can deliver it in a single 2.5" drive with none of the complexity of RAID. The drive may also be very welcome in the professional video space, but the relatively low write endurance rating of 300TB (75 total drive writes) could scare off those customers.
Putting aside the concerns about the suitability of this drive for today's market, it is a good sign for the future. Samsung is finally putting their new generation of 3D NAND on shelves in large quantities. As promised it doesn't seem to bring any new performance issues, but a SATA drive can't really prove that conclusively. The improvements to power efficiency are modest but real and every bit of that will be welcome as the 48-layer V-NAND finds its way into the rest of the product line. It is hard to tell whether the new V-NAND will be pushing prices much lower in the short term, but it looks like it will at least be competitive with what's already out there. Samsung is well positioned to continue their dominance for another round.
The 4TB 850 EVO also gives us another light push towards a future where mechanical hard drives are gone from the consumer market. Building a SSD that can entirely displace hard drives is now possible using controllers and DRAM that are cheap commodity parts. (SSDs larger than 4TB could be made using two controllers plus a RAID controller at the cost of some peak performance, a technique used by drives like the 2TB Mushkin Reactor TC.) The per-GB price of NAND flash is the only front on which SSDs still need to improve; SSDs have far surpassed mechanical hard drives in performance and power consumption and have caught up in terms of capacity and density.
The performance of the 4TB 850 EVO also makes it clear that there is even less need for a 4TB 850 Pro. An MLC counterpart simply isn't needed to reach the highest speeds that can be expected of a SATA drive, because 3D TLC drive done right and in such abundant capacity is plenty fast. The only reason Samsung should bother shipping a 4TB 850 Pro is if they're going to give it a vastly higher write endurance rating for a small price premium. Otherwise, they should save that new 3D MLC for the PCIe drives.


